
|
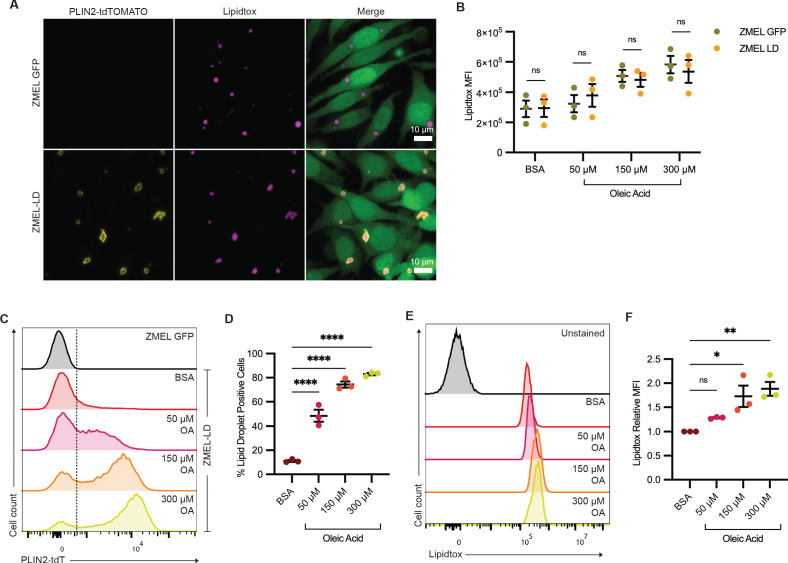
Figure 6—figure supplement 1. (A) Confocal images of ZMEL-GFP and ZMEL-LD after 24 hr of 150 µM oleic acid treatment. Cells were fixed and stained, with panels showing fluorescence signals for PLIN2-tdTOMATO, Lipidtox (lipid droplet dye), and merge of images with cytoplasmic GFP. ZMEL-GFP and ZMEL-LD cells were treated with bovine serum albumin (BSA) or increasing concentrations of oleic acid for 24 hr and then analyzed by FACS. (B) Comparison of Lipidtox median fluorescence intensity (MFI) between ZMEL-GFP and ZMEL-LD. Significance calculated via Welch’s t-test with Bonferroni correction. (C) Representative histogram of PLIN2-tdTOMATO expression of ZMEL-GFP and ZMEL-LD cells. Dashed line shows the threshold for PLIN2-tdTOMATO expression. (D) Quantification of percent of GFP+ ZMEL-LD cells with lipid droplets. Significance calculated via one-way ANOVA with Dunnett’s multiple comparison test. (E) Representative histogram of Lipidtox expression of ZMEL-LD cells. (F) Quantification of Lipidtox MFI relative to BSA control of GFP+ZMEL-LD cells. Significance calculated via one-way ANOVA with Dunnett’s multiple comparison test. N = 3 independent experiments. Bars indicate mean and SEM. *p<0.05, **p<0.01, ****p<0.0001.