
Figure 3
- ID
- ZDB-FIG-210617-45
- Publication
- Lumaquin et al., 2021 - An in vivo reporter for tracking lipid droplet dynamics in transparent zebrafish
- Other Figures
- All Figure Page
- Back to All Figure Page
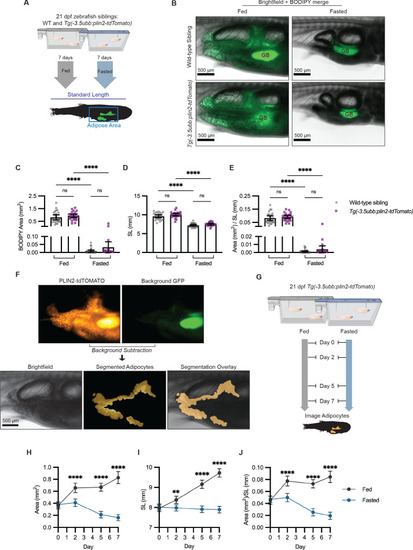
(A) Schematic of experimental set-up for fasting experiment. 21 days post-fertilization (dpf) wild-type casper and Tg(-3.5ubb:plin2-tdTomato) zebrafish were fed or fasted for 7 days and imaged to measure standard length and adipose area. (B) Representative images of zebrafish fed or fasted after 7 days. Panels show merged images of brightfield and BODIPY-stained visceral adipose tissue. BODIPY-stained adipocytes were imaged to measure (C) area, (D) standard length, and (E) area/standard length. Data points indicate individual fish for N = 3 independent experiments; bars indicate mean and 95% CI. Fed wild-type n = 24; fed Tg(-3.5ubb:plin2-tdTomato) n = 24; fasted wild-type n = 29; fasted Tg(-3.5ubb:plin2-tdTomato) n = 20. Significance calculated via Kruskal-Wallis with Dunn’s multiple comparisons test; ****p<0.0001. (F) Representative image of computational segmentation of Tg(-3.5ubb:plin2-tdTomato) adipocytes. PLIN2-tdTOMATO was background subtracted with GFP fluorescence. Bottom panels show brightfield, segmented adipocytes, and segmentation overlaid on brightfield. (G) Schematic of experimental set-up for repeated imaging of 21 dpf Tg(-3.5ubb:plin2-tdTomato) zebrafish, which were fed or fasted for 7 days. Adipose tissue was imaged and analyzed for (H) area, (I) standard length, and (J) area/standard length. Points indicate mean and error bars indicate 95% CI for N = 3 independent experiments; by day 7, fed n = 46 and fasted n = 57. Significance calculated via Mann-Whitney test; **p<0.01, ****p<0.0001. |