
- Title
-
Planar polarization of cilia in the zebrafish floor-plate involves Par3-mediated posterior localization of highly motile basal bodies
- Authors
- Donati, A., Anselme, I., Schneider-Maunoury, S., Vesque, C.
- Source
- Full text @ Development
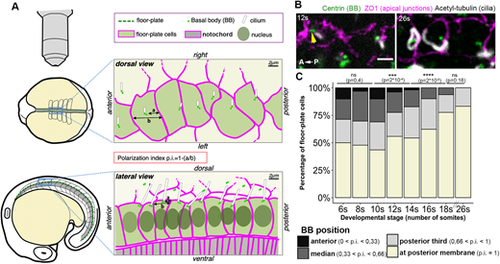
Progressive planar polarization of the zebrafish floor-plate during somitogenesis. (A) Experimental set-up used to study floor-plate planar polarization in fixed or live embryos. Early (4-12s)- or late (after 18s)-stage embryos, which display floor-plate cells with large apical surfaces, were usually imaged from the top (dorsal view, top; see also B), whereas embryos at intermediate stages (with narrower apical surfaces) were imaged from the side (lateral view; bottom). A p.i. (defined as p.i.=1−(a/b) where ‘a’ is the distance between the BB and the posterior membrane and ‘b’ the distance between anterior and posterior membranes) was used to quantify the BB position along the AP axis. (B,C) Time-course of floor-plate polarization between 6s and 26s. (B) Dorsal views of the floor-plate of flat-mounted embryos showing immunostaining against Centrin (green, BB), ZO1 (magenta, apical junctions) and acetylated-Tubulin (white, cilia) at 12s (left) and 26s (right). Cilia are already visible at 12s but are much longer at 26s. The yellow arrowhead indicates an anterior BB bearing a cilium. (C) Quantification of BB position measured from immunostained samples as shown in A. BB position along the anterior-posterior axis was quantified using the polarization index. Cells were allocated to different categories depending on their p.i. for each stage (6s: seven embryos, 108 cells; 8s: 14 embryos, 224 cells; 10s: 14 embryos, 354 cells; 12s: five embryos, 156 cells; 14s: nine embryos, 208 cells; 16s: nine embryos, 220 cells; 18s: five embryos, 143 cells; 26s: four embryos, 119 cells). ns, P>0.05; ***P<0.001; ****P<0.0001 (Wilcoxon rank sum test). Scale bar: 2 µm in B. |
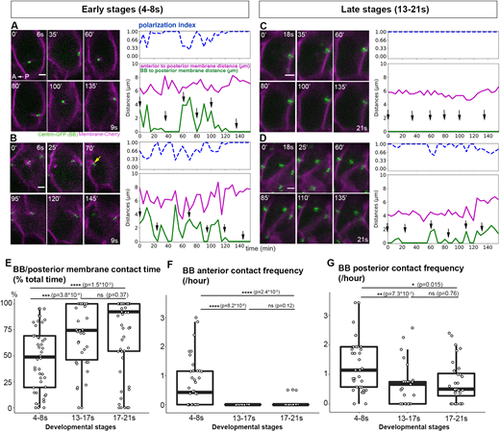
Floor-plate planar polarization involves a change in BB motile behavior. (A-D) Live imaging of BB movements during polarization. Images were taken every 5 min; selection of images from two early-stage embryos (A,B, movies between 6s and 9s; yellow arrow in B indicates an anterior contact) and two late-stage embryos (C,D, movies between 18s and 21s). Data present on the curve represent either distances (pink and green curves) or the p.i. (blue curve) of individual cells filmed in A-D over time. The distances between BBs and posterior membranes (green curve) and between the anterior and posterior membranes (magenta curve) and the p.i. (dashed blue curve) of individual cells filmed in A-D. were plotted. Black arrows on the graphs indicate the position of the images displayed on the left. Data present on the curve represent either distances (pink and green curves) or the p.i. (blue curve) of individual cells filmed in A-D over time. (E) Quantification of the percentage of total movie time spent by the BB in contact with the posterior membrane (i.e. Centrin-GFP and mCherry abut or overlap at the posterior cell membrane) (4-8s: five embryos, 41 cells; 13-17s: six embryos, 38 cells; 17-21s: seven embryos, 59 cells). Box boundaries represent the first and third quartiles of the distribution, and boxplot whiskers span 1.5 times the interquartile range of the distribution. (F,G) Number of contacts per hour between BB and the anterior (F) or posterior (G) membrane at different stages: 4-8s (5 embryos, 41 cells), 13-17s (five embryos, 25 cells) and 17-21s (seven embryos, 32 cells). Cells with a BB in contact with the posterior membrane throughout the movie (i.e. points at 100% in Fig. 1E in the main text) were not plotted in F,G. Box boundaries represent the first and third quartiles of the distribution, and boxplot whiskers span 1.5 times the interquartile range of the distribution. ns, P>0.05; *P<0.05; **P<0.01; ***P<0.001; ****P<0.0001 (Wilcoxon rank sum test). Scale bars: 2 µm. |
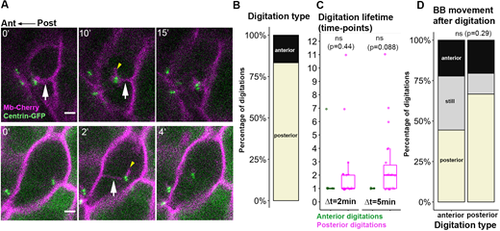
Membrane digitations link BBs to ant/post membranes during FP polarization. (A) Images from live imaging (Δt=2 or 5 min) showing posterior (top) and anterior (bottom) digitations (white arrows). Time (in min) is indicated in the upper-left corner. Short mCherry-positive digitations, presumably cilia, were associated with the BB in some cases (yellow arrowheads). (B) Percentage of posterior and anterior digitations from live-imaging analyses (54 digitations, eight embryos, 22 cells). (C) Number of time-points at which anterior or posterior digitations were detected in movies with Δt=2 or 5 min (Δt2 min: 6 anterior, 23 posterior digitations, four embryos, eight cells. Δt5 min: three anterior and 22 posterior digitations, six embryos, 13 cells). ns, P>0.05 (Wilcoxon rank sum test). Digitations were most often observed in a single or two consecutive timeframes. Box boundaries represent the first and third quartiles of the distribution, and boxplot whiskers span 1.5 times the interquartile range of the distribution. (D) BB movements after anterior or posterior digitation (48 digitations, eight embryos, 22 cells). ns, P>0.05 (Fisher's exact test). Scale bars: 2 µm. |
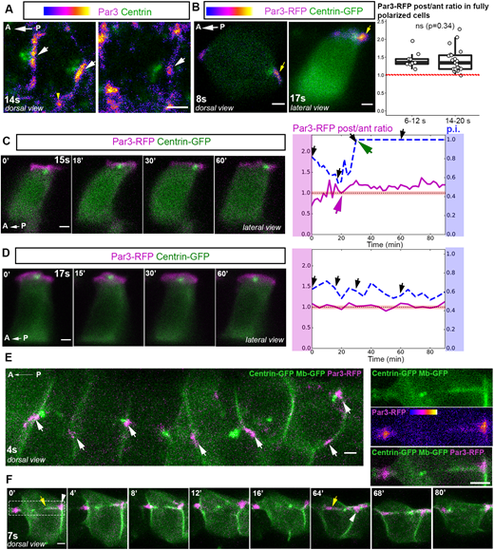
Par3 is asymmetrically localized in FP cells and forms patches at which almost all BB/membrane contacts occur. (A) Individual FP cells from dorsal views of 14s embryos showing Par3 immunofluorescence. Par3 localizes at apical junctions and is enriched at tricellular junctions (yellow arrowhead) and in patches at ant/post membranes (white arrows), regardless of whether the BB is in contact with the posterior membrane (left image) or not (right image). (B) Representative images of mosaically labeled FP cells expressing Par3-RFP and Centrin-GFP at early (8s, left) or late (17s, right) stages. Yellow arrows indicate posterior Par3-RFP enrichment. Boxplots show quantification of the Par3-RFP posterior/anterior fluorescence intensity ratio in fully polarized FP cells at early and late developmental stages. The red-dotted line indicates a ratio of 1 (6-12s, mean ratio=1.42, seven embryos, nine cells; 14-20s mean ratio=1.38, 13 embryos, 21 cells). ns, P>0.05 (Wilcoxon rank sum test). Box boundaries represent the first and third quartiles of the distribution, and boxplot whiskers span 1.5 times the interquartile range of the distribution. (C,D) Images of time-lapse movies showing individual FP cells from embryos mosaically expressing Par3-RFP (magenta) and Centrin-GFP (green) (lateral view). The Par3-RFP posterior/anterior fluorescence intensity ratios are plotted on the right (magenta lines) along with the p.i. (dashed blue curves). Black arrows indicate time-points shown in the images on the left. Dashed-black line highlights a ratio value of 1, indicating the absence of enrichment of Par3 along the posterior/anterior axis. Data are individual measurements over time of p.i. and the Par3-RFP intensity ratio along the A/P axis of cells filmed in C and D. (C) FP cell with Par3 posterior enrichment in an embryo filmed between 15s and 17s. Par3 posterior enrichment started 20 min after the beginning of the movie (magenta arrow), 10 min before BB/posterior membrane contact (green arrow). (D) FP cell with no posterior Par3 enrichment (Par3-RFP post/ant ratio close to 1) with a BB oscillating around the middle of the apical surface, in an embryo filmed between 17s and 19s. (E,F) Images from movies of early-stage embryos mosaically injected with Centrin-GFP (green), membrane-GFP (green) and Par3-RFP (magenta) mRNAs. All pictures are dorsal views of FP cells. (E) Global view of six adjacent FP cells; white arrows indicate Par3 patches (aligned along the AP axis) with which BBs make contacts during the movie. (F) Example of a BB moving back and forth and contacting the membrane at Par3 patches. Posterior and anterior membrane digitations originating from Par3 patches and partially coated with Par3 can also be seen. Yellow arrows indicate posterior (t=0′) and anterior (t=64′) digitations. White arrowheads indicate Par3 patches. Par3 patch deformation can be seen at t=64′ and at t=0′ (images on the right show a close-up of the framed region at t=0′). Scale bars: 2 µm. |
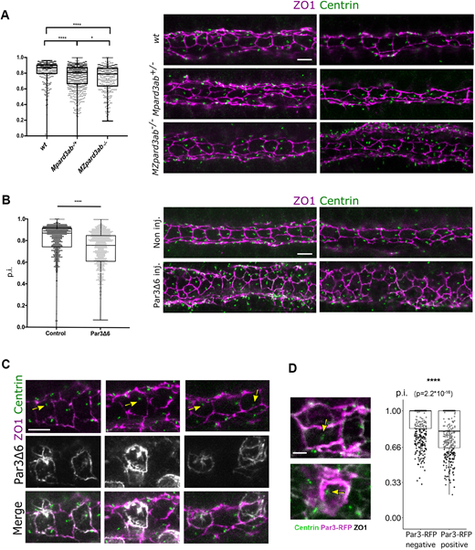
Disruption of FP polarization by Par3 depletion or perturbed localization. (A) p.i. of FP cells from wt (638 cells from nine embryos), MPard3ab+/− (644 cells from 13 embryos) and MZPard3ab−/− (303 cells from six embryos) 22s embryos. (B) p.i. of FP cells from control (596 cells from 11 embryos) or Par3Δ6-GFP-overexpressing (750 cells from eight embryos) embryos. Representative immunofluorescence images are shown on the right. (C) Representative images of FP cells from embryos mosaically expressing Par3Δ6-GFP. Yellow arrows point to BB position coinciding with high GFP expression in Par3Δ6-GFP overexpressing cells. (D) p.i. of Par3-RFP-negative and -positive FP cells from embryos mosaically overexpressing Par3-RFP. Left: representative immunostaining pictures; yellow arrows indicate mispositioned BBs in Par3-RFP-overexpressing cells (538 Par3-RFP-negative cells and 375 Par3-RFP-positive cells from 20 embryos). Scale bars: 5 µm in A-C, 2 µm in D. In A,B,D, box boundaries represent the first and third quartiles of the distribution. In A,B, boxplot whiskers represent maximum and minimum values; in D, boxplot whiskers span 1.5 times the interquartile range of the distribution. *P<0.05; ****P<0.0001 [Mann–Whitney U (Wilcoxon) test]. |
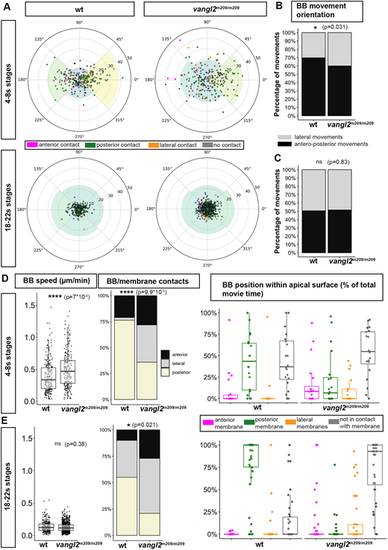
Abnormal BB behaviors in vangl2m209 mutant FP. (A) BB movements in wt (left) and vangl2m209 (right) embryos during early (top) and late (bottom) developmental stages. Each dot represents the endpoint of a single BB movement, the starting point being the center of the circle; thus, the angles outside the circle represent BB movement orientation relative to the embryo AP axis, and the distance relative to the center of the circle represents its length (circle radius is 7 µm). The color of the dots indicates whether a movement leads to a membrane contact and, if so, the nature of the contact (anterior, posterior or lateral) (early stages: wild type: eight embryos, 20 cells, 238 movements; vangl2m209: nine embryos, 20 cells, 220 movements; late stages: wild type: four embryos, 19 cells, 255 movements; vangl2m209: four embryos, 42 cells, 708 movements). (B,C) Orientation of BB movements in wt and vangl2m209 embryos during early (B) or late (C) developmental stages. ns, P>0.05; *P<0.05 (Fisher's exact test). (D,E) Speed of BB movement, nature of membrane contacts and total time spent in contact with membranes during early (D) and late (E) developmental stages. Box boundaries represent the first and third quartiles of the distribution, and boxplot whiskers span 1.5 times the interquartile range of the distribution; each dot represents one cell. ****P<0.0001 (Wilcoxon rank sum test for BB speed and Fisher's exact test for BB/membrane contacts). |
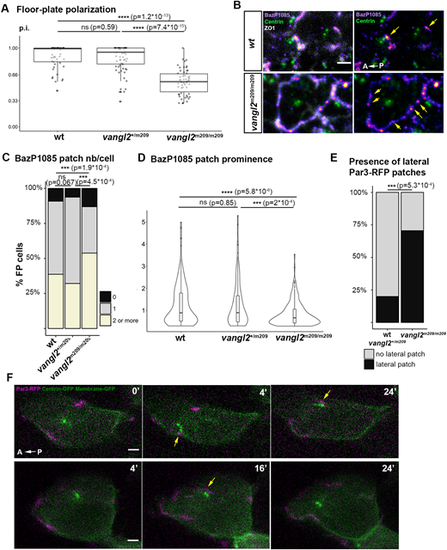
Par3 clustering and localization in vangl2m209 FP. (A) p.i. of vangl2m209/m209 determined from immunostaining data. Wild type: two embryos, 49 cells; vangl2m209/+: three embryos, 66 cells; vangl2m209/m209: five embryos, 57 cells. Box boundaries represent the first and third quartiles of the distribution, and boxplot whiskers span 1.5 times the interquartile range of the distribution; each dot represents one cell. ns P>0.05; ****P<0.0001 (Wilcoxon rank sum test). (B) Immunostaining of phosphorylated Par3 (BazP1085 antibody) in vangl2+/+ (wild type) and vangl2m209/m209 embryo FP at 18s. ZO1 staining was removed in the right images to reveal Par3 patches (yellow arrows). (C) Quantification of Par3 patch number per cell on ant/post membranes from immunostaining data as shown in B. ns P>0.05; ***P<0.001 (Fisher's exact test). (D) Prominence of Par3 patches (BazP1085 antibody) in wt and vangl2m209/m209 mutant embryo FP at 18s. ns P>0.05; ***P<0.001; ****P<0.0001 (Wilcoxon rank sum test). In A-D, vangl2+/+: seven embryos, 186 cells; vangl2m209/+: five embryos, 112 cells; vangl2m209/m209: seven embryos, 129 cells. (E) Percentage of cells displaying a lateral Par3-RFP patch in live imaging (such as in F). vangl2+/+ and vangl2m209/+: 16 embryos, 45 cells; vangl2m209/m209: seven embryos, 17 cells. ***P<0.001 (Fisher's exact test). (F) Images from two movies of 5s vangl2m209/m209 embryos mosaically injected with Par3-RFP, Centrin-GFP and Membrane-GFP mRNA at the 16- to 32-cell stage. Yellow arrows indicate contact events between lateral Par3 patches and BBs. Scale bars: 2 µm. |
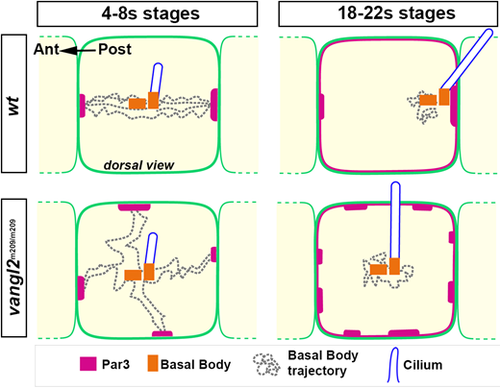
Summary of BB behavior and Par3 localization during early and late stages of development in the FP of wt and vangl2 zebrafish mutants. In wt embryos during 4-8s stages, the BBs, which anchor a growing cilium, shuttle between anterior and posterior cell apical junctions, and contact membranes only at the level of Par3 patches. Par3 becomes progressively enriched at posterior junctions. By 18-22s stages, the vast majority of BBs are stably docked to a posterior patch of Par3. BBs from vangl2−/− embryos during the 4-8s stages are motile and make poorly oriented membrane contacts. They still contact Par3 patches, which are fragmented and equally distributed between lateral and antero-posterior membranes. By the 18-22s stages, vangl2−/− BBs occupy a central position within the apical surface. |