
Fig. 2
- ID
- ZDB-IMAGE-220301-2
- Publication
- Donati et al., 2021 - Planar polarization of cilia in the zebrafish floor-plate involves Par3-mediated posterior localization of highly motile basal bodies
- All Figures
- Figures for Donati et al., 2021
|
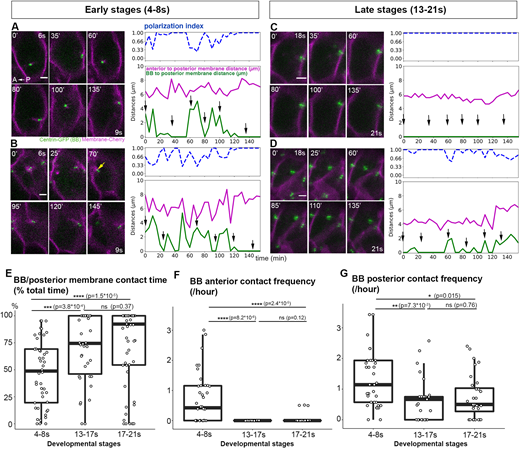
Fig. 2 Floor-plate planar polarization involves a change in BB motile behavior. (A-D) Live imaging of BB movements during polarization. Images were taken every 5 min; selection of images from two early-stage embryos (A,B, movies between 6s and 9s; yellow arrow in B indicates an anterior contact) and two late-stage embryos (C,D, movies between 18s and 21s). Data present on the curve represent either distances (pink and green curves) or the p.i. (blue curve) of individual cells filmed in A-D over time. The distances between BBs and posterior membranes (green curve) and between the anterior and posterior membranes (magenta curve) and the p.i. (dashed blue curve) of individual cells filmed in A-D. were plotted. Black arrows on the graphs indicate the position of the images displayed on the left. Data present on the curve represent either distances (pink and green curves) or the p.i. (blue curve) of individual cells filmed in A-D over time. (E) Quantification of the percentage of total movie time spent by the BB in contact with the posterior membrane (i.e. Centrin-GFP and mCherry abut or overlap at the posterior cell membrane) (4-8s: five embryos, 41 cells; 13-17s: six embryos, 38 cells; 17-21s: seven embryos, 59 cells). Box boundaries represent the first and third quartiles of the distribution, and boxplot whiskers span 1.5 times the interquartile range of the distribution. (F,G) Number of contacts per hour between BB and the anterior (F) or posterior (G) membrane at different stages: 4-8s (5 embryos, 41 cells), 13-17s (five embryos, 25 cells) and 17-21s (seven embryos, 32 cells). Cells with a BB in contact with the posterior membrane throughout the movie (i.e. points at 100% in Fig. 1E in the main text) were not plotted in F,G. Box boundaries represent the first and third quartiles of the distribution, and boxplot whiskers span 1.5 times the interquartile range of the distribution. ns, P>0.05; *P<0.05; **P<0.01; ***P<0.001; ****P<0.0001 (Wilcoxon rank sum test). Scale bars: 2 µm.