
Fig. 4
- ID
- ZDB-IMAGE-220301-4
- Publication
- Donati et al., 2021 - Planar polarization of cilia in the zebrafish floor-plate involves Par3-mediated posterior localization of highly motile basal bodies
- All Figures
- Figures for Donati et al., 2021
|
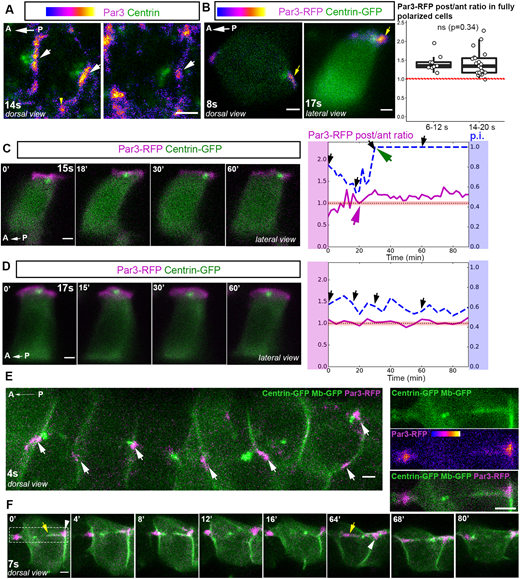
Fig. 4 Par3 is asymmetrically localized in FP cells and forms patches at which almost all BB/membrane contacts occur. (A) Individual FP cells from dorsal views of 14s embryos showing Par3 immunofluorescence. Par3 localizes at apical junctions and is enriched at tricellular junctions (yellow arrowhead) and in patches at ant/post membranes (white arrows), regardless of whether the BB is in contact with the posterior membrane (left image) or not (right image). (B) Representative images of mosaically labeled FP cells expressing Par3-RFP and Centrin-GFP at early (8s, left) or late (17s, right) stages. Yellow arrows indicate posterior Par3-RFP enrichment. Boxplots show quantification of the Par3-RFP posterior/anterior fluorescence intensity ratio in fully polarized FP cells at early and late developmental stages. The red-dotted line indicates a ratio of 1 (6-12s, mean ratio=1.42, seven embryos, nine cells; 14-20s mean ratio=1.38, 13 embryos, 21 cells). ns, P>0.05 (Wilcoxon rank sum test). Box boundaries represent the first and third quartiles of the distribution, and boxplot whiskers span 1.5 times the interquartile range of the distribution. (C,D) Images of time-lapse movies showing individual FP cells from embryos mosaically expressing Par3-RFP (magenta) and Centrin-GFP (green) (lateral view). The Par3-RFP posterior/anterior fluorescence intensity ratios are plotted on the right (magenta lines) along with the p.i. (dashed blue curves). Black arrows indicate time-points shown in the images on the left. Dashed-black line highlights a ratio value of 1, indicating the absence of enrichment of Par3 along the posterior/anterior axis. Data are individual measurements over time of p.i. and the Par3-RFP intensity ratio along the A/P axis of cells filmed in C and D. (C) FP cell with Par3 posterior enrichment in an embryo filmed between 15s and 17s. Par3 posterior enrichment started 20 min after the beginning of the movie (magenta arrow), 10 min before BB/posterior membrane contact (green arrow). (D) FP cell with no posterior Par3 enrichment (Par3-RFP post/ant ratio close to 1) with a BB oscillating around the middle of the apical surface, in an embryo filmed between 17s and 19s. (E,F) Images from movies of early-stage embryos mosaically injected with Centrin-GFP (green), membrane-GFP (green) and Par3-RFP (magenta) mRNAs. All pictures are dorsal views of FP cells. (E) Global view of six adjacent FP cells; white arrows indicate Par3 patches (aligned along the AP axis) with which BBs make contacts during the movie. (F) Example of a BB moving back and forth and contacting the membrane at Par3 patches. Posterior and anterior membrane digitations originating from Par3 patches and partially coated with Par3 can also be seen. Yellow arrows indicate posterior (t=0′) and anterior (t=64′) digitations. White arrowheads indicate Par3 patches. Par3 patch deformation can be seen at t=64′ and at t=0′ (images on the right show a close-up of the framed region at t=0′). Scale bars: 2 µm.