
Fig. 5
- ID
- ZDB-FIG-220301-11
- Publication
- Donati et al., 2021 - Planar polarization of cilia in the zebrafish floor-plate involves Par3-mediated posterior localization of highly motile basal bodies
- Other Figures
- All Figure Page
- Back to All Figure Page
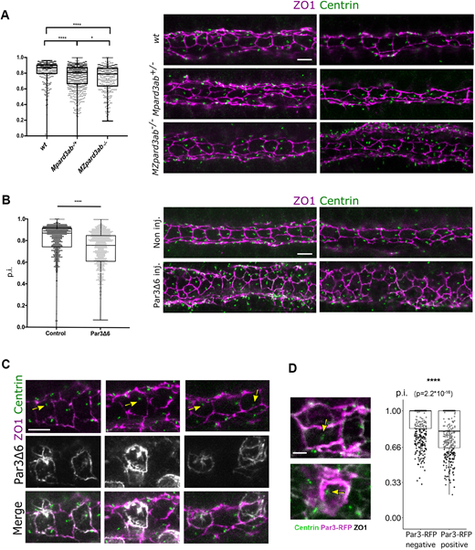
Disruption of FP polarization by Par3 depletion or perturbed localization. (A) p.i. of FP cells from wt (638 cells from nine embryos), MPard3ab+/− (644 cells from 13 embryos) and MZPard3ab−/− (303 cells from six embryos) 22s embryos. (B) p.i. of FP cells from control (596 cells from 11 embryos) or Par3Δ6-GFP-overexpressing (750 cells from eight embryos) embryos. Representative immunofluorescence images are shown on the right. (C) Representative images of FP cells from embryos mosaically expressing Par3Δ6-GFP. Yellow arrows point to BB position coinciding with high GFP expression in Par3Δ6-GFP overexpressing cells. (D) p.i. of Par3-RFP-negative and -positive FP cells from embryos mosaically overexpressing Par3-RFP. Left: representative immunostaining pictures; yellow arrows indicate mispositioned BBs in Par3-RFP-overexpressing cells (538 Par3-RFP-negative cells and 375 Par3-RFP-positive cells from 20 embryos). Scale bars: 5 µm in A-C, 2 µm in D. In A,B,D, box boundaries represent the first and third quartiles of the distribution. In A,B, boxplot whiskers represent maximum and minimum values; in D, boxplot whiskers span 1.5 times the interquartile range of the distribution. *P<0.05; ****P<0.0001 [Mann–Whitney U (Wilcoxon) test]. |