- Title
-
FOXM1 nuclear transcription factor translocates into mitochondria and inhibits oxidative phosphorylation
- Authors
- Black, M., Arumugam, P., Shukla, S., Pradhan, A., Ustiyan, V., Milewski, D., Kalinichenko, V.V., Kalin, T.V.
- Source
- Full text @ Mol. Biol. Cell
|
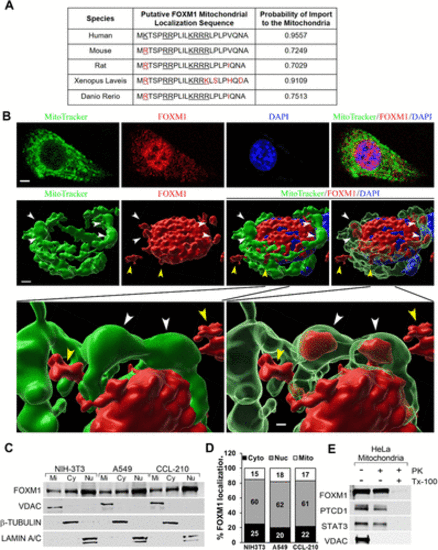
FOXM1 nuclear transcription factor is found in the mitochondria. (A) FOXM1 protein contains a highly conserved putative mitochondrial localization sequence (MLS). The MitoProt computational program predicted a positively charged (underlined) MLS in the N-terminus of FOXM1. FOXM1 MLS is highly conserved among several species (black font). Red color shows the differences compared with the MLS of human FOXM1. The probability of localization to the mitochondria for each FOXM1 orthologue was determined by MitoProt analysis. (B) Detection of FOXM1 in the mitochondria. High-resolution 3D confocal images show colocalization of FOXM1 (red) with mitochondrial marker MitoTracker (green) in NIH-3T3 cells. Nuclei were counterstained with DAPI. FOXM1 is present in the nucleus, mitochondria, and cytoplasm. White arrowheads point to the mitochondria with FOXM1 inside. Yellow arrowheads point to the cytoplasmic FOXM1. Magnification: ×100; 20 μm scale bar. (C) The presence of FOXM1 in mitochondrial (Mi), cytoplasmic (Cy), and nuclear (Nu) fractions is shown by Western blot with antibodies against FOXM1, VDAC (mitochondrial protein), β-TUBULIN (cytoplasmic protein), and LAMIN A/C (nuclear protein). (D) Quantification of FOXM1 protein levels in mitochondrial (Mi), cytoplasmic (Cy), and nuclear (Nu) fractions using densitometry. (E) Mitochondrial FOXM1 is proteinase K–resistant. Mitochondrial fraction was incubated without (lane 1) or with (lanes 2 and 3) 10 µg/ml proteinase K (PK). To disrupt mitochondrial integrity, 1% Triton X-100 (TX-100) was added in the digestion buffer (lane 3). Samples were probed for FOXM1, PTCD1 (mitochondrial matrix protein), STAT3 (inner membrane protein), and VDAC (mitochondrial outer membrane protein). |
|
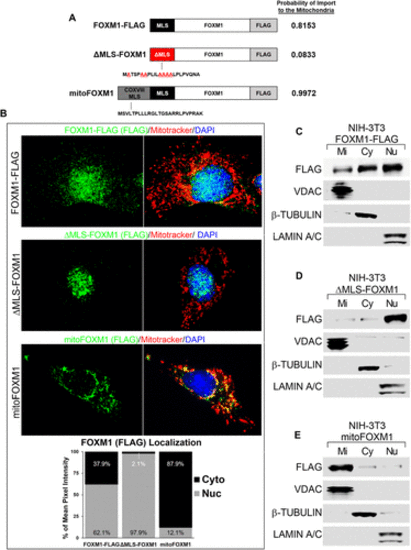
Mitochondrial localization sequence in FOXM1 is required for translocation of FOXM1 to mitochondria. (A) Schematic representation of FLAG-tagged FOXM1 protein constructs with wild-type MLS (black box), mutated MLS (red box), and COX VIII MLS fused to FOXM1 (gray–black box). The probability of each construct to be imported to the mitochondria was determined using MitoProt (Claros and Vincens, 1996). (B) Cellular localization of FLAG-tagged FOXM1 fusion proteins. NIH-3T3 cells transfected with FOXM1-FLAG, ΔMLS-FOXM1, or mitoFOXM1 were used for colocalization studies with FLAG antibody (exogenous FOXM1) (green) and MitoTracker dye (red). Nuclei were counterstained with DAPI. Magnification: ×100; 20 μm scale bar. The intensity of FOXM1 fluorescence signal (green) in cytoplasmic (Cyto) and nuclear (Nuc) compartments was determined using CellProfiler software and is presented as the percent of mean pixel intensity (n = 7/group). (C–E) Western blots show the efficient localization of FOXM1 FLAG-tagged protein into different cellular compartments. NIH-3T3 cells expressing FOXM1-FLAG (C), ΔMLS-FOXM1 (D), or mitoFOXM1 (E) constructs were used to prepare mitochondrial (Mi), cytoplasmic (Cy), and nucleic (Nu) fractions. Western blots were probed with antibodies against FLAG (exogenous FOXM1), VDAC (mitochondrial protein), β-TUBULIN (cytoplasmic protein), and LAMIN A/C (nuclear protein). |
|
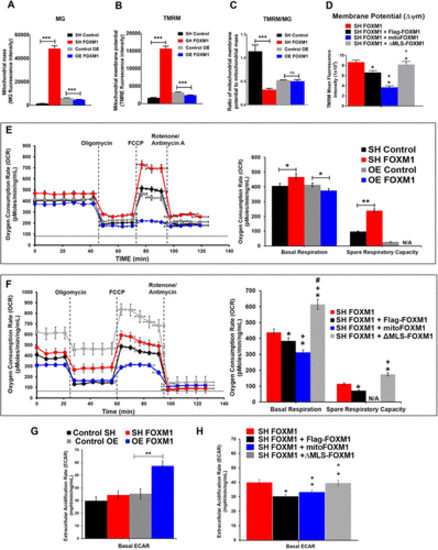
Mitochondrial FOXM1 inhibits mitochondrial membrane potential and oxidative phosphorylation. NIH-3T3 cells were costained with TMRM (mitochondria membrane potential) and MitoTracker green (MT, mitochondria mass) to assess membrane potential in MT green–stained cells using flow cytometry. (A) Loss of FOXM1 (SH FOXM1 cells) increases mitochondrial mass; overexpression of FOXM1 (OE FOXM1 cells) decreases mitochondrial mass. (B) Loss of FOXM1 increases mitochondrial membrane potential; overexpression of FOXM1 decreases mitochondrial membrane potential. (C) The ratio of mitochondrial membrane potential to mitochondrial mass is decreased in FOXM1-depleted cells and is unchanged in FOXM1-overexpressing cells compared with control mock-transduced cells. (D) Mitochondrial FOXM1 inhibits mitochondrial membrane potential. NIH-3T3 cells stably expressing SH FOXM1 were transiently transfected with FOXM1-FLAG, ΔMLS-FOXM1, or mitoFOXM1. Tetramethylrhodamine methyl ester (TMRM) dye that accumulates in active mitochondria with intact membrane potentials was used to stain cells and analyzed by flow cytometry. MFI, mean fluorescence intensity. Data represent mean ± SEM from experiments in triplicate. * indicates statistical significance of p < 0.05 compared with SH FOXM1. + indicates statistical significance of p < 0.05 compared with SH FOXM1 + FLAG-FOXM1. ^ indicates statistical significance of p < 0.05 compared with SH FOXM1 + mitoFOXM1. (E) Mitochondrial respiration measured by Seahorse XFe assay in NIH-3T3 cell lines with stable overexpression or knockdown of FOXM1. The oxygen consumption rate (OCR, pmol/min/ng/ml) was decreased in response to overexpression of FOXM1, and increased in response to knockdown of FOXM1 compared with controls. Graphs represent data from five independent experiments. (F) Mitochondrial FOXM1 inhibits oxidative phosphorylation. NIH-3T3 cells stably expressing SH FOXM1 were transiently transfected with indicated constructs. Red dotted line represents OCR values from NIH-3T3 cells stably expressing SH FOXM1 only. Mitochondrial oxygen consumption rate (OCR, pmol/min/ng/ml) was measured under basal conditions and in response to modulators of the electron transport chain. Graphs represent data from four replicate experiments. Data represent mean ± SEM, n = 4, ANOVA, Bonferroni’s post test. * indicates statistical significance of p < 0.05 compared with SH FOXM1. + indicates statistical significance of p < 0.05 compared with SH FOXM1 + FLAG-FOXM1. #indicates statistical significance of p < 0.05 compared with SH FOXM1 + mitoFOXM1. (G) Stable overexpression of FOXM1 increased glycolysis. Under basal conditions, the extracellular acidification rate (ECAR, mpH/min/ng/m[), a readout for glycolysis, is directly correlated with FOXM1 levels. Graphs represent data from five replicate experiments (mean ± SEM, n = 5, ANOVA, Bonferroni’s post test, **p < 0.01 indicates statistical significance. (H) Mitochondrial and nuclear FOXM1 increased glycolysis shown by increased ECAR. NIH-3T3 cells stably expressing SH FOXM1 were transiently transfected with the indicated constructs. ECAR was increased in MLS FOXM1 mutants compared with FLAG-FOXM1 expressing cells. Graphs represent data from four replicate experiments. Data represent mean ± SEM, n = 5, ANOVA, Bonferroni’s post test. * indicates statistical significance of p < 0.05 compared with SH FOXM1. + indicates statistical significance of p < 0.05 compared with SH FOXM1 + FLAG-FOXM1. ^ indicates statistical significance of p < 0.05 compared with SH FOXM1 + mitoFOXM1. |
|
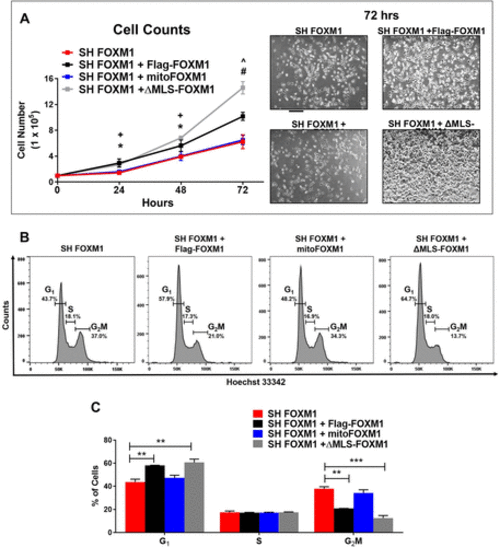
Translocation of FOXM1 to the mitochondria does not affect proliferation. (A) Growth curves of SH FOXM1 cells transfected with FLAG-FOXM1, mitoFOXM1, or ΔMLS-FOXM1 constructs. Cells were counted at 24, 48, and 72 h. Representative images are shown for each group at 72 h. Magnification: ×5; 100 μm scale bar. Graph represents data from n = 5 replicates presented as mean ± SEM, n = 5, ANOVA, Bonferroni’s post test. * indicates statistical significance of p < 0.05 comparing SH FOXM1 + Flag-FOXM1 to SH FOXM1. + indicates statistical significance of p < 0.05 comparing SH FOXM1 + ΔMLS-FOXM1 to SH FOXM1. #indicates statistical significance of p < 0.001 comparing SH FOXM1 + ΔMLS-FOXM1 to SH FOXM1. ^ indicates statistical significance of p < 0.001 comparing SH FOXM1 + Flag-FOXM1 to SH FOXM1. (B) Effects of FOXM1 localization on cell cycle distribution. SH FOXM1 cells were transfected with the indicated MLS mutant constructs, and cell cycle analysis was measured using Hoechst 3342 and flow cytometry 72 h post–serum starvation. (C) Representative quantitative chart depicts cell cycle phase. Graph represents G1, S, and G2/M phases and values are presented as mean ± SEM from four replicates. Red dotted line represents OCR values from NIH-3T3 cells stably expressing SH FOXM1 alone. Statistical significance is indicated with an asterisk (*); *p < 0.05, **p < 0.01, and ***p < 0.001. |
|
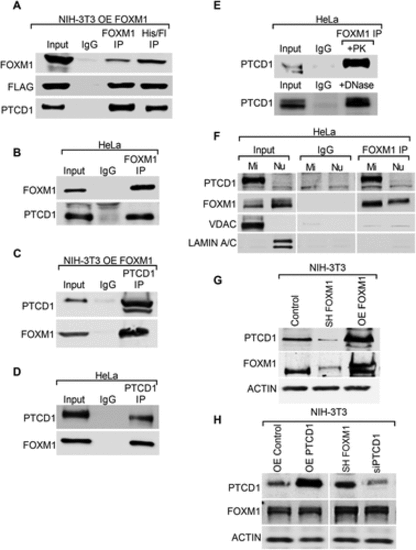
FOXM1 and PTCD1 are protein binding partners. (A) PTCD1 in FOXM1 immunoprecipitates. NIH-3T3 cells expressing FOXM1 (OE FOXM1), which contains HIS and FLAG tags, were subjected to 2-step affinity chromatography using anti-FLAG and anti-HIS affinity columns. The elutes were analyzed by Western blot using antibodies for FOXM1, FLAG, and PTCD1. Cells incubated with IgG were used as controls. (B) Immunoblots show immunoprecipitation (IP) of endogenous FOXM1 with PTCD1 in HeLa cells. (C, D) FOXM1 in PTCD1 immunoprecipitates. (C) NIH-3T3 cells expressing FOXM1 (OE FOXM1) or (D) HeLa cells immunoprecipitated using PTCD1 antibody. Immunoblots show IP of endogenous PTCD1 protein with FOXM1. (E) Proteinase K and DNase treatments do not influence interactions of endogenous FOXM1 with PTCD1. Total wild-type HeLa cell lysates were incubated with 10 µg/ml proteinase K (PK) or DNase for 30 min. FOXM1 IP experiments were performed, and blots were probed with PTCD1 antibodies. (F) FOXM1 and PTCD1 are bound in mitochondrial lysates. FOXM1 or nonspecific isotype-matched IgG was incubated with purified mitochondrial (Mi) and nuclear (Nu) fractions from HeLa cells. Immunoprecipitates were resolved on SDS–PAGE and probed for PTCD1, FOXM1, VDAC (mitochondrial protein), and LAMIN A/C (nuclear protein). (G) FOXM1 directly correlates with PTCD1 protein levels. Immunoblots show FOXM1 and PTCD1 protein levels in total cell lysates of NIH-3T3 cells that stably express control, shFOXM1, and OE FOXM1. ACTIN was used as a loading control. (H) Changes in PTCD1 does not affect FOXM1 levels. NIH-3T3 cells were transiently transfected with the indicated constructs. Immunoblots show FOXM1 and PTCD1 protein levels in total lysates of NIH-3T3 cells expressing OE CONTROL, OE PTCD1, siCONTROL, and siPTCD1. β -ACTIN was used as a loading control. |
|
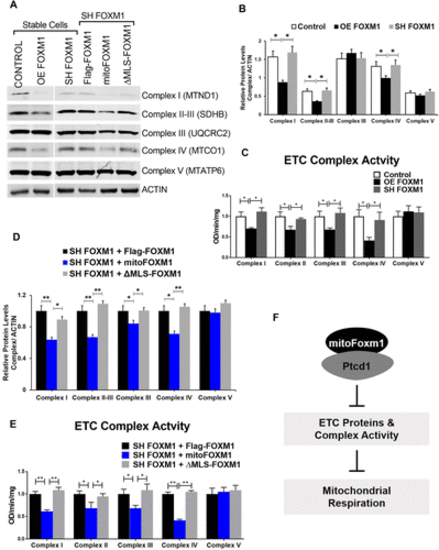
Mitochondrial FOXM1 decreases ETC complex protein levels and activity. (A) Western blot analysis of mitochondrial proteins. Total cellular proteins from FOXM1 stable cell lines and SH FOXM1 cells expressing MLS mutant constructs were probed for proteins from each ETC complex and β-ACTIN as a loading control. MTATP6 indicates protein subunit 6 from ETC complex V; MTCO1 indicates protein subunit 1 from ETC complex IV; UQCRC2 indicates protein subunit 2 from ETC complex III; SDHB indicates protein subunit from ETC complex II; MTND1 indicates protein subunit 1 from ETC complex I. (B) Densitometric quantification of mitochondrial proteins in stable control and OE FOXM1 and SH FOXM1 cell lines. Average MTND1, SDHB, MTCO1, UQCRC2, or MTATP6 levels were normalized to ACTIN. Values are expressed relative to Flag-FOXM1 control. Data represent mean ± SEM from three determinations. Statistical significance is indicated with an asterisk; *p < 0.05. (C) Enzymatic activities of respiratory chain complexes in stable control and OE FOXM1 and SH FOXM1 cell lines. The activities of respiratory complexes were investigated by enzymatic assays on complexes I, II, III, IV, and V in mitochondrial or total cell lysates. Activities are expressed as OD absorbance/min/mg total protein or mitochondrial protein. Data represent mean ± SEM from experiments in triplicate. Statistical significance is indicated with an asterisk; *p < 0.05. (D) Densitometric quantification of mitochondrial proteins in SH FOXM1 cells expressing MLS mutant constructs. Average MTND1, SDHB, MTCO1, UQCRC2, or MTATP6 levels were normalized to ACTIN. Values are expressed as relative to Flag-FOXM1 control. Data represent mean ± SEM from three determinations. Statistical significance is indicated with an asterisk; *p < 0.05, **p < 0.01. (E) Enzymatic activities of respiratory chain complexes in SH FOXM1 cells expressing MLS mutant constructs. The activities of respiratory complexes were investigated by enzymatic assays on complexes I, II, III, IV, and V in mitochondrial or total cell lysates. Activities are expressed as OD absorbance/min/mg total protein or mitochondrial protein. Data represent mean ± SEM from experiments in triplicate. Statistical significance is indicated with an asterisk; *p < 0.05, **p < 0.01. (F) Schematic diagram. FOXM1 translocates into the mitochondria, interacts with PTCD, and inhibits mitochondrial respiration. |

