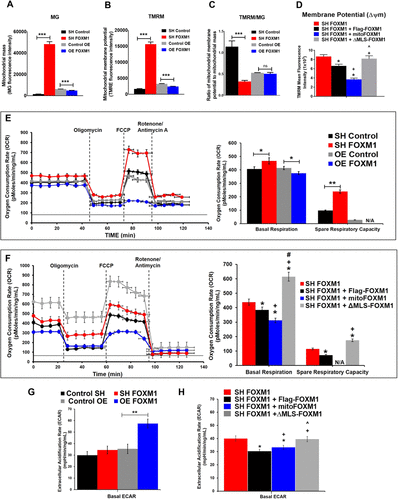
Fig. 3 Mitochondrial FOXM1 inhibits mitochondrial membrane potential and oxidative phosphorylation. NIH-3T3 cells were costained with TMRM (mitochondria membrane potential) and MitoTracker green (MT, mitochondria mass) to assess membrane potential in MT green–stained cells using flow cytometry. (A) Loss of FOXM1 (SH FOXM1 cells) increases mitochondrial mass; overexpression of FOXM1 (OE FOXM1 cells) decreases mitochondrial mass. (B) Loss of FOXM1 increases mitochondrial membrane potential; overexpression of FOXM1 decreases mitochondrial membrane potential. (C) The ratio of mitochondrial membrane potential to mitochondrial mass is decreased in FOXM1-depleted cells and is unchanged in FOXM1-overexpressing cells compared with control mock-transduced cells. (D) Mitochondrial FOXM1 inhibits mitochondrial membrane potential. NIH-3T3 cells stably expressing SH FOXM1 were transiently transfected with FOXM1-FLAG, ΔMLS-FOXM1, or mitoFOXM1. Tetramethylrhodamine methyl ester (TMRM) dye that accumulates in active mitochondria with intact membrane potentials was used to stain cells and analyzed by flow cytometry. MFI, mean fluorescence intensity. Data represent mean ± SEM from experiments in triplicate. * indicates statistical significance of p < 0.05 compared with SH FOXM1. + indicates statistical significance of p < 0.05 compared with SH FOXM1 + FLAG-FOXM1. ^ indicates statistical significance of p < 0.05 compared with SH FOXM1 + mitoFOXM1. (E) Mitochondrial respiration measured by Seahorse XFe assay in NIH-3T3 cell lines with stable overexpression or knockdown of FOXM1. The oxygen consumption rate (OCR, pmol/min/ng/ml) was decreased in response to overexpression of FOXM1, and increased in response to knockdown of FOXM1 compared with controls. Graphs represent data from five independent experiments. (F) Mitochondrial FOXM1 inhibits oxidative phosphorylation. NIH-3T3 cells stably expressing SH FOXM1 were transiently transfected with indicated constructs. Red dotted line represents OCR values from NIH-3T3 cells stably expressing SH FOXM1 only. Mitochondrial oxygen consumption rate (OCR, pmol/min/ng/ml) was measured under basal conditions and in response to modulators of the electron transport chain. Graphs represent data from four replicate experiments. Data represent mean ± SEM, n = 4, ANOVA, Bonferroni’s post test. * indicates statistical significance of p < 0.05 compared with SH FOXM1. + indicates statistical significance of p < 0.05 compared with SH FOXM1 + FLAG-FOXM1. #indicates statistical significance of p < 0.05 compared with SH FOXM1 + mitoFOXM1. (G) Stable overexpression of FOXM1 increased glycolysis. Under basal conditions, the extracellular acidification rate (ECAR, mpH/min/ng/m[), a readout for glycolysis, is directly correlated with FOXM1 levels. Graphs represent data from five replicate experiments (mean ± SEM, n = 5, ANOVA, Bonferroni’s post test, **p < 0.01 indicates statistical significance. (H) Mitochondrial and nuclear FOXM1 increased glycolysis shown by increased ECAR. NIH-3T3 cells stably expressing SH FOXM1 were transiently transfected with the indicated constructs. ECAR was increased in MLS FOXM1 mutants compared with FLAG-FOXM1 expressing cells. Graphs represent data from four replicate experiments. Data represent mean ± SEM, n = 5, ANOVA, Bonferroni’s post test. * indicates statistical significance of p < 0.05 compared with SH FOXM1. + indicates statistical significance of p < 0.05 compared with SH FOXM1 + FLAG-FOXM1. ^ indicates statistical significance of p < 0.05 compared with SH FOXM1 + mitoFOXM1.
Image
Figure Caption
Acknowledgments
This image is the copyrighted work of the attributed author or publisher, and
ZFIN has permission only to display this image to its users.
Additional permissions should be obtained from the applicable author or publisher of the image.
Full text @ Mol. Biol. Cell

