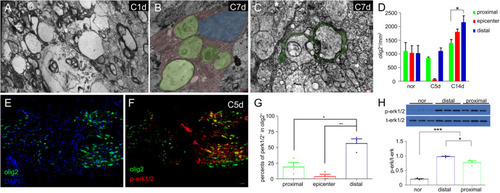
Oligodendrocytes survived after optic nerve injury. a At 1 dpi, axons degenerated in the distal stump, inducing myelin collapse. b At 7 dpi, microglia/macrophages (pink) ingested myelin debris (green). c Remyelination (green) started to ensheath regenerated axons at 7 dpi. d Statistical analysis of olig2+ cells in the proximal segment, epicenter, and distal segment at different times after injury. e-f At 5 dpi, olig2+ cells were not found in the epicenter. Most olig2+ cells in the distal stump (right side) expressed p-erk1/2 (yellow cells), while the proximal cells (left side) did not. g The percentage of p-erk1/2 in olig2+ cells in the distal segments was significantly higher than that in the proximal segments at 5 dpi. h Compared with the expression level of p-erk1/2 protein in the normal optic nerve, the proximal segments and the distal segments were at 5 dpi by western. Scale bar: 200 nm (a-c), 20 μm (f).

mOLs from donor adult zebrafish rewrapped axons in the host fish at 3 mpt. a-c Two nuclei were found in an olig2+ cell at 5 dpt (single focus), which suggests that olig2+ cells could proliferate in the host zebrafish. d-e Olig2+ cells from the donor optic nerve survived in the host (d) and remyelinated along the whole optic nerve (e). f-h MBP staining showing that olig2+ processes were mature myelin processes (single focus). i-k In the cross-section, olig2+ cells in the host fish rewrapped regenerated axons (arrows). Scale bars: 10 μm (a-c, e), 100 μm (d), 5 μm (f-h); 2 μm (i-k). The left side in (d-h) represents the proximal segment

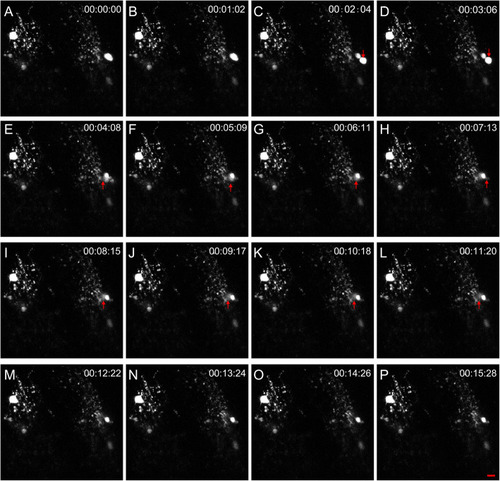
Imaging proliferation of local oligodendrocytes in the transplanted optic nerve. Two olig2+ cells in the transplanted optic nerve project their processes to large areas, suggesting that they are complex oligodendrocytes. At 1 min 2 s, olig2+ cell division was not observed. At 2 min 4 s, a new olig2+ cell was divided from one olig2+ cell, and the whole progress was completed within 1 min. The newborn olig2+ cell migrated to the right at 3 min 6 s (descending arrow) and then migrated into the deeper space from 4 min 8 s to 11 min 20 s (ascending arrow). Finally, the cell migrated out of focus at 12 min 22 s. Each image has 25 optic slices, the interval is 1 μm, and the scale bar is 10 μm

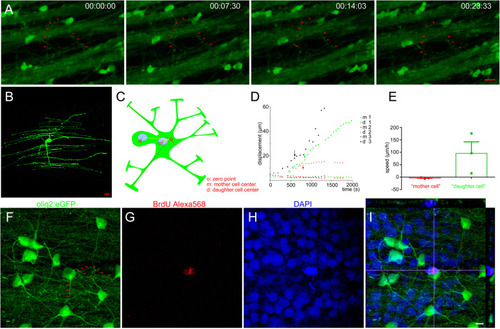
mOLs within the retina are divided in an asymmetric manner. a Serial imaging showed that the mOL within the retina was under division. Arrows indicate the processes that maintained integrity during the whole imaging. b The olig2+ cell within the retina is in a mature state, as shown by the perfect myelin structure. c Schematic picture shows the method to calculate cell displacement in the asymmetric division of mOL. The origin point is the crossover of two random myelin processes. d The displacement of the mother and daughter cells in the asymmetric division of mOLs within the retina. Arrows show the time point at which division was completed. e Speeds of mother and daughter cells. Daughter cells had a high migration ability while mother cells did not (p < 0.05). f-i BrdU results show that a mOL within the retina was proliferating, while the myelin structure remained integral (arrows). The image has 10 slices, and the interval is 0.5 μm. Scale bar: 10 μm (a-b); 5 μm (f-i)

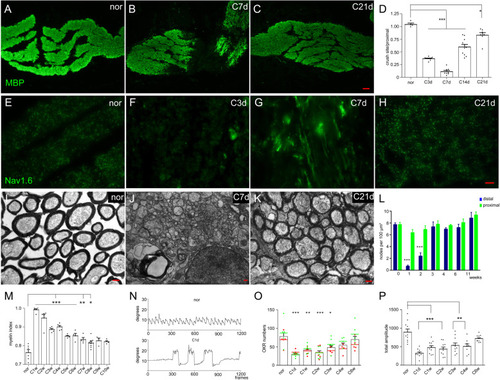
Visual function recovery after the completion of remyelination. a-c Qualitative results showing the restoration of MBP at different times after optic nerve injury. d Statistical results showing that the MBP intensity at the injury site was lowest at 7 dpi and gradually recovered in the following weeks. e-h Qualitative images showing Nav1.6 staining at different times after injury. At 7 dpi, Nav1.6 in the distal stump presented a linear pattern (g). i-k Qualitative images showing the myelin sheath at different times after optic nerve injury. Demyelination was completed at 7 dpi (j), but remyelination mostly occurred at 21 dpi (k). l Statistical results showing that the density of Ranvier nodes in the proximal region was not influenced by optic nerve injury, while it was greatly decreased in the distal region during the first two weeks and then returned to normal at 3 wpi. m Statistical results showing that the myelin index was gradually restored in the following weeks and completely finished at 9 wpi (p > 0.05). n Qualitative figures showing the nystagmus of normal and injured fish in the ocellanae OKR test. On the first day after optic nerve injury (down line), eye movement was voluntary (the large amplitude movements), and the nystagmus was much weaker in injuried fish than in normal fish (up line). o The preference of clockwise orientation in the injured eye was recovered at 3 wpi, and the OKR number was recovered at 4 wpi, indicated that the second-order visual function was restored. p The total amplitude of right eye nystagmus recovered, and the results indicated that fine visual function was restored at 6 wpi. The left side in A-C represents the proximal segment. Scale bar: 20 μm (a-c); 10 μm (e-h); 200 nm (i-k)

Acknowledgments
This image is the copyrighted work of the attributed author or publisher, and ZFIN has permission only to display this image to its users. Additional permissions should be obtained from the applicable author or publisher of the image. Full text @ Cell Regen (Lond)