
- Title
-
longfin causes cis-ectopic expression of the kcnh2a ether-a-go-go K+ channel to autonomously prolong fin outgrowth
- Authors
- Stewart, S., Le Bleu, H.K., Yette, G.A., Henner, A.L., Robbins, A.E., Braunstein, J.A., Stankunas, K.
- Source
- Full text @ Development
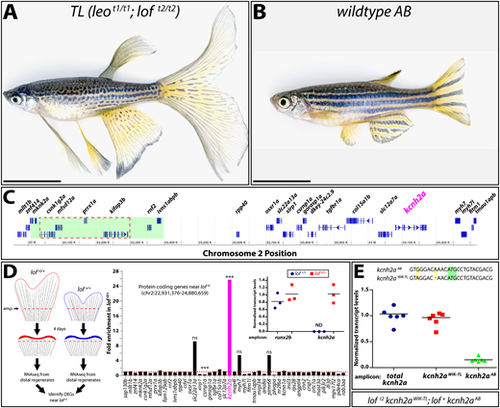
The loft2 mutation causes cis-ectopic expression of kcnh2a. (A,B) Bright-field images of adult TL (Tüpfel longfin: leot1/t1; loft2/t2) and wild-type AB zebrafish. Scale bars: 1 cm. (C) Schematic diagram of 1.5 Mb region of zebrafish chromosome 2 (chr2). The putative location of the loft2 mutation is outlined with a dashed red line and the region deleted in the suppressed lofjg1 is highlighted by a green box, as determined by Iovine and Johnson (2002). (D) Left: schematic of RNA-Seq experimental design to identify genes mis-expressed in regenerated loft2. Right: RNA-Seq data showing gene expression at chr2:22,931,376-24,880,659 from loft2/+ relative to clutchmate lof+/+ controls. The asterisks indicate the two differentially expressed genes (***P<10−4). ns, not significant. Inset: expression of kcnh2a in loft2/+ (in red) and lof+/+ (in blue) clutchmates determined by RT-qPCR using 4 dpa fin cDNA. Data were normalized to rpl8 reference expression levels and are presented as fold change relative to loft2/+. runx2b expression levels are shown for comparative purposes and were not significantly changed between the two genotypes. Expression of kcnh2a was below limits of detection in lof+/+ fish (indeterminate, ND). Each point represents a cohort of three animals. (E) RT-qPCR on 4 dpa caudal fin cDNA from loft2 kcnh2aWIK-TL; lof+ kcnh2aAB fish to detect chromosome-specific expression of kcnh2a. Sequences of non-coding kcnh2a polymorphisms that specifically amplify either kcnh2aWIK-TL, which is located on the loft2 mutant chr2 (red squares), or kcnh2aAB, which is located on AB chr2 (green triangles). Data were normalized to total kcnh2a levels (blue circles) determined using primers that amplify both alleles indiscriminately. Each data point represents a result from an individual fish. RT-qPCR statistical analyses used one-way ANOVA with Tukey's multiple comparisons tests. |
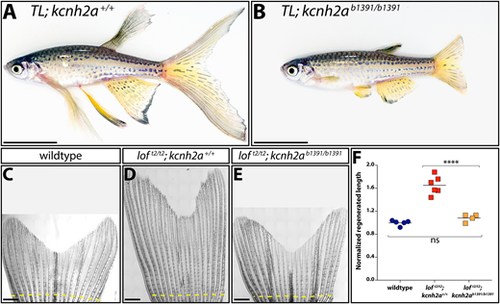
Fin overgrowth in loft2 requires kcnh2a. (A,B) Bright-field images of clutchmate TL; kcnh2a+/+ (A) and TL; kcnh2ab1391/b1391 (B) adult zebrafish. Scale bars: 1 cm. (C-E) Representative images of regenerated caudal fins at 27 days post-amputation (dpa) from (C) wild-type control, (D) loft2/t2; kcnh2a+/+ and (E) loft2/t2; kcnh2ab1391/b1391 fish. The dashed yellow line indicates the site of fin resection. Scale bars: 1 mm. (F) Quantification of fin ray outgrowth of wild-type (blue circles), loft2/t2; kcnh2+/+ (red squares) and loft2/t2; kcnh2ab1391/b1391 (orange squares) fish at 27 dpa. Each data point represents the normalized length of ray 3 from an individual animal of the indicated genotype. ****P<0.005 (one-way ANOVA with Tukey's multiple comparisons tests). ns, not significant. PHENOTYPE:
|
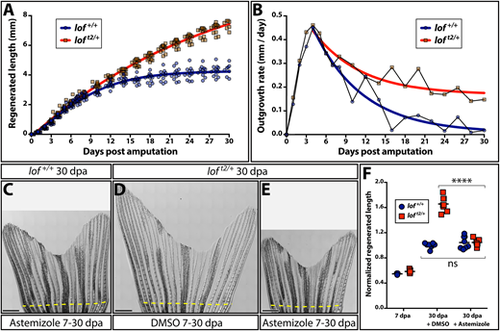
Kcnh2a actively prolongs the fin outgrowth period in loft2. (A) Plots comparing the growth (A) and growth rate (B) of regenerating loft2/+ (blue) and clutchmate lof+/+ (red) caudal fins. Curves show actual data fit to (A) a logistic equation reflecting establishment and then progressively slowing outgrowth phases, and (B) an exponential decay equation using time points after the peak growth rate is reached. All data points (≥12 fish per time) are shown in A and mean values are used in B. (C-E) Stitched DIC images showing clutchmate lof+/+ astemizole-treated (C; 500 nM), DMSO-treated loft2/+ (D) and loft2/+, astemizole-treated (E; 500 nM) fish at 30 days post-caudal fin amputation (dpa). The dashed yellow line indicates the amputation plane. Scale bars: 1 mm. (F) Quantification of normalized caudal fin regenerative outgrowth from control and astemizole-treated animals. Data points represent individual lof+/+ (blue circles) and loft2/+ (red squares) animals prior to treatment (7 dpa) and post-treatment (30 dpa) with DMSO or astemizole (500 nM). Graph shows mean lengths of the third ventral regenerated ray normalized to DMSO-treated controls at 30 dpa. Each point is an individual animal. ****P<0.0001 for DMSO treated from 7-30 dpa compared with wild-type and loft2/+ fin lengths; no significant differences between genotypes at 7 dpa or when comparing 7-30 dpa astemizole-treated wild-type and loft2/+ regenerative outgrowth. Statistical tests used one-way ANOVA with Tukey's multiple comparisons tests. PHENOTYPE:
|
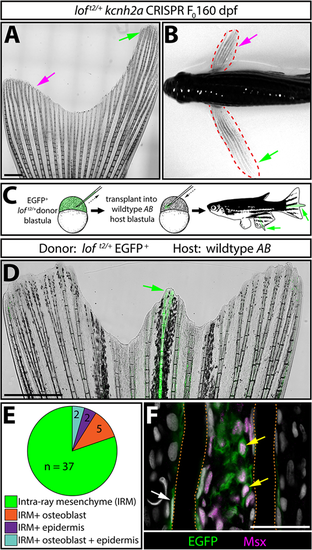
kcnh2a acts fin autonomously and within the intra-ray mesenchyme lineage to promote overgrowth. (A) Representative whole-mount image of a F0kcnh2a CRISPR loft2/+ adult caudal fin at 160 days post-fertilization. The magenta arrow indicates suppressed overgrowth in otherwise long fins (green arrow). Scale bar: 1 mm. (B) Pectoral fin asymmetry in a kcnh2a F0 CRISPR loft2/+ animal. The magenta arrow indicates a wild-type-sized fin indicative of phenotypic suppression. The green arrow indicates the overgrown contralateral fin expected of the loft2/+ genotype. (C) Upper panel schematic highlighting the nature of the blastula stage transplant experiment. EGFP+loft2/+ blastula cells were transplanted into wild-type AB embryos. Reared adults with partial or complete fin overgrowth were scored for cell type(s) with EGFP expression. (D) A representative example of a caudal fin displaying overgrown EGFP+ fin rays. The green arrow indicates overgrown EGFP+ fin rays. Scale bar: 1 mm. (E) The pie chart indicates the EGFP+ lineage(s) present in 39 overgrown regions across 30 total fins with extended rays. (F) Caudal fin section of an overgrown chimeric fin ray immunostained with EGFP and Msx antibodies. Yellow arrows indicate EGFP+/Msx+ intra-ray mesenchymal cells. The white arrow highlights an EGFP+ osteoblast. Fin rays are outlined with a dashed orange line. Hoechst-stained nuclei are in gray. Scale bar: 50 µm. |
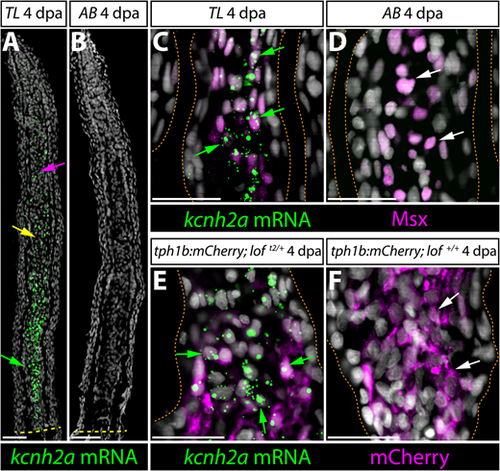
kcnh2a is expressed ectopically in loft2 intra-ray mesenchyme lineage cells during fin regeneration. (A,B) kcnh2a mRNA localization (in green) detected by RNAscope in longitudinal caudal fin sections from 4 days post-amputation (dpa) TL (loft2/t2, A) and AB (B) animals. The green arrow indicates proximal intra-ray cells expressing high levels of kcnh2a, which is also detected in medial mesenchyme (yellow arrow) and distal cells (magenta arrow) of TL fish. The dashed yellow line indicates the site of amputation. Hoechst stained nuclei are in gray. Scale bars: 50 µm. (C,D) Double kcnh2a RNAscope (green) and Msx immunostaining (magenta) of 4 dpa caudal fin sections from TL (C) and AB (D) fish. (E,F) Combination kcnh2a RNAscope (green) and mCherry immunostaining (magenta) of 4 dpa fin sections from (E) tph1b:mCherry; loft2/+ and (F) tph1b:mCherry; lof+/+ fish. For C-F, green arrows highlight Msx+ or tph1b:mCherry+ cells with overlapping kcnh2a mRNA in proximal regenerating lof tissue. White arrows indicate Msx+ or tph1b:mCherry+ nuclei in corresponding regions from control fins lacking kcnh2a expression. Fin rays are outlined with a dashed orange line. Hoechst-stained nuclei are in gray. Scale bars: 50 µm. |
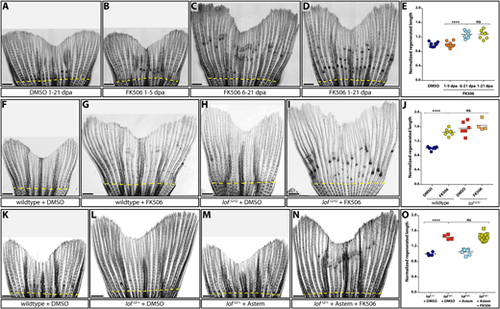
Kcnh2a-disrupted calcineurin signaling gradually terminates fin outgrowth. (A-D) Calcineurin gradually ends the fin outgrowth period. Stitched DIC images showing wild-type 21 day post amputation (dpa) caudal fins treated with DMSO (A) or 500 nM FK506 from either 1-5 (B), 6-21 (C) or 1-21 (D) dpa. (E) Quantification of the experiments presented in A-D. Data are the average regenerated lengths of the third ray normalized to DMSO-treated controls at 21 dpa. Each point is a single wild-type animal treated with either DMSO 1-21 dpa (dark blue circles) or FK506 for the indicated times (orange circles, 1-5 dpa; light-blue circles, 6-21 dpa; gold circles, 1-21 dpa). (F-I) Ectopic Kcnh2a and FK506 treatment do not cooperate during overgrowth. DIC-imaged regenerated caudal fins from wild-type (F,G) and loft2/t2 (H,I) animals treated with DMSO (F,H) or 500 nM FK506 (G,I) daily from 1-23 dpa. (J) Graph showing relative regenerate lengths of ray 3 at 23 dpa from wild-type fish treated with DMSO or FK506 (blue or gold circles, respectively), and loft2/t2 fish treated with DMSO or FK506 (red or orange squares, respectively). Each data point is from an individual fish. (K-N) Kcnh2a activity is not required for FK506-induced overgrowth. Images showing wild-type (K) and loft2/+ clutchmate (L-N) caudal fin regenerates at 21 dpa. Animals were treated from 7-21 dpa with DMSO vehicle (K,L), 500 nM astemizole (M) or 500 nM astemizole+500 nM FK506 (N). (O) Plot showing relative regenerative fin growth of ray 3 from the samples described in K-N. Data points represent individual animals: DMSO-treated lof+/+ or loft2/+ (dark-blue circles and red squares, respectively), astemizole-treated loft2/+ (light-blue squares), and loft2/+ treated with both FK506 and astemizole (gold squares). Data are normalized to DMSO-treated wild-type samples. Dashed yellow lines indicate amputation sites. Each data point represents an individual animal. ****P<0.001; ns, not significant. Scale bars: 1 mm. One-way ANOVA with Tukey's multiple comparisons tests tested differences between regenerated fin lengths. PHENOTYPE:
|