
Fig. 6
- ID
- ZDB-IMAGE-211103-89
- Publication
- Stewart et al., 2021 - longfin causes cis-ectopic expression of the kcnh2a ether-a-go-go K+ channel to autonomously prolong fin outgrowth
- All Figures
- Figures for Stewart et al., 2021
|
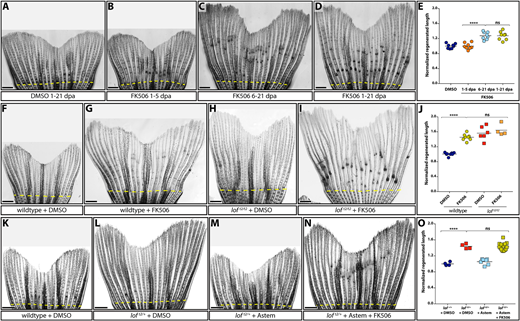
Fig. 6 Kcnh2a-disrupted calcineurin signaling gradually terminates fin outgrowth. (A-D) Calcineurin gradually ends the fin outgrowth period. Stitched DIC images showing wild-type 21 day post amputation (dpa) caudal fins treated with DMSO (A) or 500 nM FK506 from either 1-5 (B), 6-21 (C) or 1-21 (D) dpa. (E) Quantification of the experiments presented in A-D. Data are the average regenerated lengths of the third ray normalized to DMSO-treated controls at 21 dpa. Each point is a single wild-type animal treated with either DMSO 1-21 dpa (dark blue circles) or FK506 for the indicated times (orange circles, 1-5 dpa; light-blue circles, 6-21 dpa; gold circles, 1-21 dpa). (F-I) Ectopic Kcnh2a and FK506 treatment do not cooperate during overgrowth. DIC-imaged regenerated caudal fins from wild-type (F,G) and loft2/t2 (H,I) animals treated with DMSO (F,H) or 500 nM FK506 (G,I) daily from 1-23 dpa. (J) Graph showing relative regenerate lengths of ray 3 at 23 dpa from wild-type fish treated with DMSO or FK506 (blue or gold circles, respectively), and loft2/t2 fish treated with DMSO or FK506 (red or orange squares, respectively). Each data point is from an individual fish. (K-N) Kcnh2a activity is not required for FK506-induced overgrowth. Images showing wild-type (K) and loft2/+ clutchmate (L-N) caudal fin regenerates at 21 dpa. Animals were treated from 7-21 dpa with DMSO vehicle (K,L), 500 nM astemizole (M) or 500 nM astemizole+500 nM FK506 (N). (O) Plot showing relative regenerative fin growth of ray 3 from the samples described in K-N. Data points represent individual animals: DMSO-treated lof+/+ or loft2/+ (dark-blue circles and red squares, respectively), astemizole-treated loft2/+ (light-blue squares), and loft2/+ treated with both FK506 and astemizole (gold squares). Data are normalized to DMSO-treated wild-type samples. Dashed yellow lines indicate amputation sites. Each data point represents an individual animal. ****P<0.001; ns, not significant. Scale bars: 1 mm. One-way ANOVA with Tukey's multiple comparisons tests tested differences between regenerated fin lengths.