
Fig. 4
- ID
- ZDB-FIG-211103-87
- Publication
- Stewart et al., 2021 - longfin causes cis-ectopic expression of the kcnh2a ether-a-go-go K+ channel to autonomously prolong fin outgrowth
- Other Figures
- All Figure Page
- Back to All Figure Page
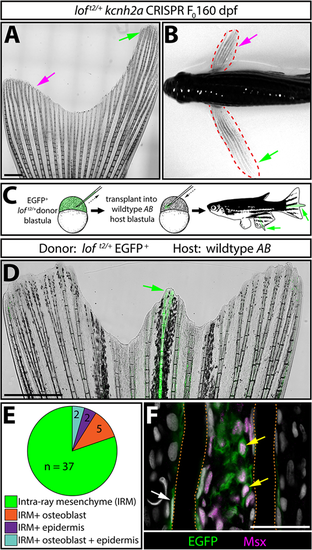
kcnh2a acts fin autonomously and within the intra-ray mesenchyme lineage to promote overgrowth. (A) Representative whole-mount image of a F0kcnh2a CRISPR loft2/+ adult caudal fin at 160 days post-fertilization. The magenta arrow indicates suppressed overgrowth in otherwise long fins (green arrow). Scale bar: 1 mm. (B) Pectoral fin asymmetry in a kcnh2a F0 CRISPR loft2/+ animal. The magenta arrow indicates a wild-type-sized fin indicative of phenotypic suppression. The green arrow indicates the overgrown contralateral fin expected of the loft2/+ genotype. (C) Upper panel schematic highlighting the nature of the blastula stage transplant experiment. EGFP+loft2/+ blastula cells were transplanted into wild-type AB embryos. Reared adults with partial or complete fin overgrowth were scored for cell type(s) with EGFP expression. (D) A representative example of a caudal fin displaying overgrown EGFP+ fin rays. The green arrow indicates overgrown EGFP+ fin rays. Scale bar: 1 mm. (E) The pie chart indicates the EGFP+ lineage(s) present in 39 overgrown regions across 30 total fins with extended rays. (F) Caudal fin section of an overgrown chimeric fin ray immunostained with EGFP and Msx antibodies. Yellow arrows indicate EGFP+/Msx+ intra-ray mesenchymal cells. The white arrow highlights an EGFP+ osteoblast. Fin rays are outlined with a dashed orange line. Hoechst-stained nuclei are in gray. Scale bar: 50 µm. |