
Fig. 3
- ID
- ZDB-IMAGE-211103-86
- Publication
- Stewart et al., 2021 - longfin causes cis-ectopic expression of the kcnh2a ether-a-go-go K+ channel to autonomously prolong fin outgrowth
- All Figures
- Figures for Stewart et al., 2021
|
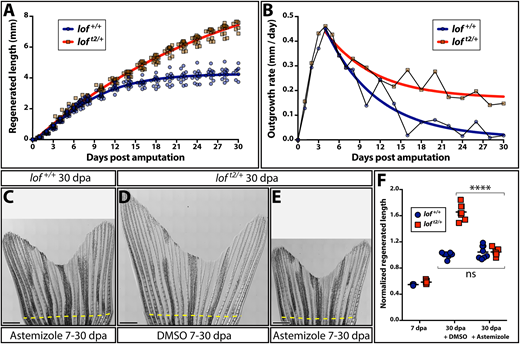
Fig. 3 Kcnh2a actively prolongs the fin outgrowth period in loft2. (A) Plots comparing the growth (A) and growth rate (B) of regenerating loft2/+ (blue) and clutchmate lof+/+ (red) caudal fins. Curves show actual data fit to (A) a logistic equation reflecting establishment and then progressively slowing outgrowth phases, and (B) an exponential decay equation using time points after the peak growth rate is reached. All data points (≥12 fish per time) are shown in A and mean values are used in B. (C-E) Stitched DIC images showing clutchmate lof+/+ astemizole-treated (C; 500 nM), DMSO-treated loft2/+ (D) and loft2/+, astemizole-treated (E; 500 nM) fish at 30 days post-caudal fin amputation (dpa). The dashed yellow line indicates the amputation plane. Scale bars: 1 mm. (F) Quantification of normalized caudal fin regenerative outgrowth from control and astemizole-treated animals. Data points represent individual lof+/+ (blue circles) and loft2/+ (red squares) animals prior to treatment (7 dpa) and post-treatment (30 dpa) with DMSO or astemizole (500 nM). Graph shows mean lengths of the third ventral regenerated ray normalized to DMSO-treated controls at 30 dpa. Each point is an individual animal. ****P<0.0001 for DMSO treated from 7-30 dpa compared with wild-type and loft2/+ fin lengths; no significant differences between genotypes at 7 dpa or when comparing 7-30 dpa astemizole-treated wild-type and loft2/+ regenerative outgrowth. Statistical tests used one-way ANOVA with Tukey's multiple comparisons tests.