FIGURE SUMMARY
Title

Potential of peptide-engineered exosomes with overexpressed miR-92b-3p in anti-angiogenic therapy of ovarian cancer

Authors
Wang, J., Wang, C., Li, Y., Li, M., Zhu, T., Shen, Z., Wang, H., Lv, W., Wang, X., Cheng, X., Xie, X.
Source
Full text @ Clin Transl Med

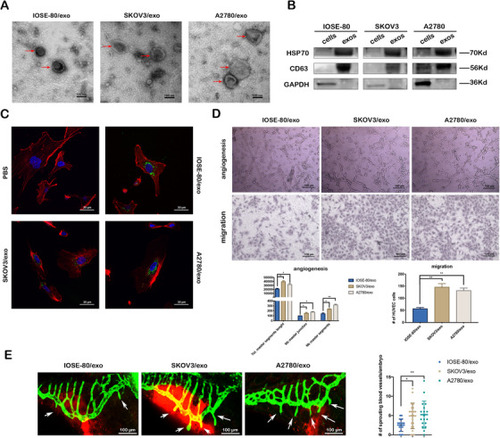
Cancer cell‐derived exosomes promote the angiogenesis and migration viability of HUVECs in vitro and in vivo. (A) Representative TEM images of exosomes (red arrows) (scale bar = 100 nm). (B) Western blotting of the whole‐cell lysates or exosome lysates for the classical exosomal protein markers (CD63 and Hsp70) and GAPDH. (C) Representative confocal microscope images of F‐actin (red), nucleus (blue), and PKH67‐labeled exosomes (green) in HUVECs co‐cultured with various exosomes or PBS for 24 h (scale bar = 30 μm). (D) Representative images of tube formation and migration of HUVECs treated by IOSE‐80/exo, SKOV3/exo, and A2780/exo, respectively (scale bar = 100 μm). Total master segments length, number of master junctions, master nodes, and migration cells were regarded as indicators of angiogenic ability in vitro and assessed by ImageJ (mean ± SD, n = 3). (E) Left: Representative confocal images of zebrafish vessel models injected with IOSE‐80/exo, SKOV3/exo, or A2780/exo. The subintestinal vessels (SIV) (green) and exosomes (red) are shown. White arrows indicate newly formed blood vessels. Right: Quantification of the number of ectopic sprouts observed per fish (mean ± SD) injected with IOSE‐80/exo (n = 16), SKOV3/exo (n = 22), and A2780/exo (n = 18), respectively. Data are shown by at least three independent experiments, and the Student's t‐test was used to compare differences. *p < .05, **p < .01

miR‐92b‐3p acts as a suppressor of tumor‐associated angiogenesis. (A) Venn diagram of the overlapping differentially expressed miRNAs (p < .05) common to two miRNA sequencings (IOSE‐80/exo vs. SKOV3/exo and IOSE‐80/exo vs. A2780/exo). (B) The heatmap of differentially expressed miRNAs (p < .05) (IOSE‐80/exo vs. SKOV3/exo and IOSE‐80/exo vs. A2780/exo). (C) qRT‐PCR validation of difference in miRNA expressions between IOSE‐80/exo and two ovarian cancer cell exosomes (mean ± SD, n = 3), data were normalized to the level of U6. Black arrow indicates miR‐92b‐3p. (D) qRT‐PCR analysis on miR‐92b‐3p expression in ovarian cancer cell lines compared to IOSE‐80 cell line (mean ± SD, n = 3), data were normalized to the level of U6. (E) Expression of miR‐92b‐3p in ovarian cancer and normal tissue samples in GSE131790 data. (F) Representative images of tube formation and migration of HUVECs transfected with miR‐92b‐3p mimics or miR‐92b‐3p inhibitor (scale bar = 100 μm), compared to the negative controls. Total master segments length, number of master junctions, master nodes, and migration cells were regarded as indicators of angiogenic ability in vitro and assessed by ImageJ (mean ± SD, n = 3). (G) Left: Representative images of trunk vasculature in Tg(fli‐1:EGFP) embryos injected with NC mimics or miR‐92b‐3p mimics (scale bar = 200 μm). Right: Percentage of defective vasculogenesis in zebrafish with NC mimics (n = 18) or miR‐92b‐3p mimics (n = 23). Data are shown by at least three independent experiments, and the Student's t‐test was used to compare differences. *p < .05, **p < .01, ***p < .001, ****p < .0001

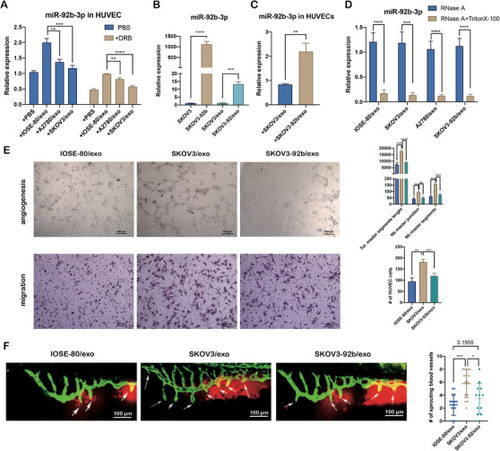
Exosomal miR‐92b‐3p modulates tumor‐associated angiogenesis. (A) qRT‐PCR analysis on the relative expression of miR‐92b‐3p in HUVECs treated with IOSE‐80/exo, SKOV3/exo, and A2780/exo, respectively, for 48 h with or without 5,6‐dichlorobenzimidazole 1‐β‐D‐ribofuranoside (DRB) (20 μm/ml), compared to HUVECs treated with PBS (mean ± SD, n = 3). (B) qRT‐PCR analysis on the relative expressions of miR‐92b‐3p in SKOV3 cells, SKOV3‐92b cells, SKOV3/exo, and SKOV3‐92b/exo (mean ± SD, n = 3). (C) qRT‐PCR analysis on relative expression of miR‐92b‐3p in HUVECs treated with SKOV3/exo or SKOV3‐92b/exo (mean ± SD, n = 3). (D) qRT‐PCR analysis on the expression of miR‐92b‐3p in exosomes after enzyme digestion, with or without destroyed membranes by Triton X‐100 (mean ± SD, n = 3). (E) Representative images of tube formation and migration of HUVECs treated with SKOV3/exo and SKOV3‐92b/exo, respectively (scale bar = 100 μm). Total master segments length, number of master junctions, number of master nodes, and migration cell numbers were regarded as indicators of angiogenic ability in vitro and assessed by ImageJ (mean ± SD, n = 3). (F) Left: Representative confocal images of the trunk vasculature of zebrafish injected with SKOV3‐NC/exo or SKOV3‐92b/exo (scale bar = 100 μm). Right: Quantification of the number of ectopic sprouts observed per fish (mean ± SD) injected with SKOV3/exo (n = 14) or SKOV3‐92b/exo (n = 12), respectively. Data are shown by at least three independent experiments and the Student's t‐test was used to compare differences. *p < .05, **p < .01, ***p < .001, ****p < .0001

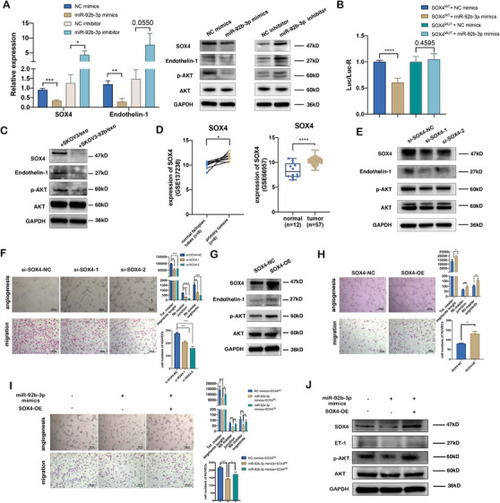
SOX4 is a target of exosomal miR‐92b‐3p and participates in exosomal miR‐92b‐3p modulating angiogenesis. (A) qRT‐PCR analysis (left) and Western blotting (right) of the relative expressions of SOX4, endothelin‐1, and p‐AKT in HUVECs transfected with miR‐92b‐3p mimics or miR‐92b‐3p inhibitor (mean ± SD, n = 3). (B) Dual luciferase reporter of verifying the combination between 3′UTR of SOX4 gene and miR‐92b‐3p. The pmirGLO reporters containing 3′UTR of human SOX4 gene with wild‐type (wt) or mutated (mut) miR‐92b‐3p binding sites were used to transfect HUVECs while treating with miR‐92b‐3p mimics or NC mimics (control). Luciferase activity was analyzed at 48 h post transfection (n = 6 extracts) and the ratio between Renilla luciferase and firefly luciferase activities (Rluc/Fluc) is shown. (C) Western blotting of the expression level of SOX4, endothelin‐1, and p‐AKT in HUVECs treated with SKOV3/exo and SKOV3‐92b/exo, respectively. (D) Relative expression of SOX4 in ovarian tumors compared to the epithelium of the normal fallopian tubes (GSE137238 data, left) and normal ovarian tissues (GSE66957 data, right). (E) Western blotting of the expressions of SOX4, endothelin‐1, and p‐AKT in HUVECs transfected with two siRNAs of SOX4 (si‐SOX4‐1, si‐SOX4‐2). (F) Representative images of tube formation and migration of HUVECs treated with si‐SOX4‐1 or si‐SOX4‐2 (scale bar = 100 μm). Total master segments length, number of master junctions, number of master nodes, and migration cell numbers were regarded as indicators of angiogenic ability in vitro and assessed by ImageJ (mean ± SD, n = 3). (G) Western blotting of the expressions of SOX4, endothelin‐1, and p‐AKT in HUVECs transfected with SOX4‐overexpression plasmids. (H) Representative images of tube formation and migration of HUVECs treated with SOX4‐overexpression plasmids (scale bar = 100 μm). Total master segments length, number of master junctions, number of master nodes, and migration cell numbers were regarded as indicators of angiogenesis ability in vitro and assessed by ImageJ (mean ± SD, n = 3). (I) Representative images of tube formation and migration of HUVECs treated with miR‐92b‐3p mimics or miR‐92b‐3p mimics plus SOX4‐plasmids. Total master segments length, number of master junctions, master nodes, and migration cells were regarded as indicators of angiogenic ability in vitro and assessed by ImageJ (mean ± SD, n = 3) (scale bar = 100 μm). (J) Western blotting of SOX4, endothelin‐1, and p‐AKT proteins in HUVECs cotransfected with miR‐92b‐3p mimics plus SOX4 plasmids. Data are shown by at least three independent experiments, and the Student's t‐test was used to compare differences. *p < .05, **p < .01, ***p < .001, ****p < .0001

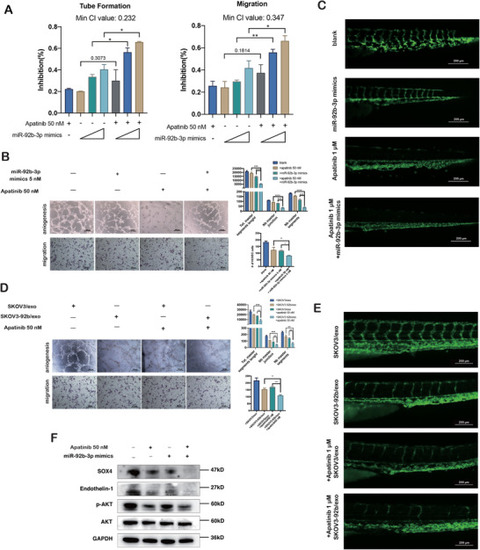
Exosomal miR‐92b‐3p and Apatinib represent the synergistic anti‐angiogenic effect. (A) Inhibition rates of tube formation and migration of HUVECs treated with Apatinib or miR‐92b‐3p mimics alone or both combined (mean ± SD, n = 3). In the Apatinib‐treated group, the working concentration was 50 nM. In the miR‐92b‐3p mimics group, the working concentrations were 1, 2, and 5 nM. In the combined Apatinib and miR‐92b‐3p mimics treated group, the working concentrations were 50 nM for Apatinib and 1, 2, and 5 nM for miR‐92b‐3p, respectively. Minimum CI values of tube formation and migration are shown. Data are shown as mean ± SD of the percentage of change when compared to full medium‐treated group (n = 3). The miR‐92b‐3p mimics treated groups were used as negative controls. (B) Representative images of tube formation and migration of HUVECs treated with Apatinib (50 nM) and miR‐92b‐3p (5 nM) (scale bar = 100 μm). Total master segments length, number of master junctions, master nodes, and migration cells were regarded as indicators of angiogenic ability in vitro and assessed by ImageJ (mean ± SD, n = 3). (C) Representative images of zebrafish embryos treated with Apatinib (1 μM), miR‐92b‐3p mimics, and Apatinib (1 μM) plus miR‐92b‐3p, respectively (scale bar = 100 μm). (D) Representative images of tube formation and migration of HUVECs treated with SKOV3/exo, SKOV3‐92b/exo, Apatinib, and SKOV3‐92b/exo plus Apatinib (mean ± SD, n = 3), respectively (scale bar = 100 μm). Total master segments length, number of master junctions, master nodes, and migration cells were regarded as indicators of angiogenic ability in vitro and assessed by ImageJ (mean ± SD, n = 3). (E) Representative images of zebrafish embryos treated with SKOV3/exo, SKOV3‐92b/exo, Apatinib, and SKOV3‐92b/exo plus Apatinib, respectively (scale bar = 200 μm). (F) Western blotting of the expression levels of SOX4, endothelin‐1, and p‐AKT treated by miR‐92b‐3p (5 nM) plus Apatinib (50 nM). Data are shown by at least three independent experiments, and the Student's t‐test was used to compare differences. *p < .05, **p < .01, ***p < .001, ****p < .0001

Engineered RGD‐SKOV3‐92b/exo alone or combined with Apatinib inhibits tumor growth in vivo. (A) Representative confocal microscopy images of HUVECs treated with SKOV‐92b/exo or RGD‐SKOV3‐92b/exo. F‐actin (red), nucleus (blue), and PKH67‐labeled exosomes (green) were stained (scale bar = 30 μm). Relative uptake was calculated using ImageJ software. (B) Total fluorescence values of nude mice in different groups. There were no differences among randomization groups for any of the characteristics. (C) Schematic protocol of intraperitoneal xenografted tumors in animal experiments. (D) Bioluminescence images of nude mice with different exosomal injections or Apatinib treatment. Total fluorescence values were assessed by fluorescence imaging (n = 5 per group). Data are shown by at least three independent experiments. The Student's t‐test and nonparametric test were used to compare differences. *p < .05, **p < .01, ***p < .001, ****p < .0001

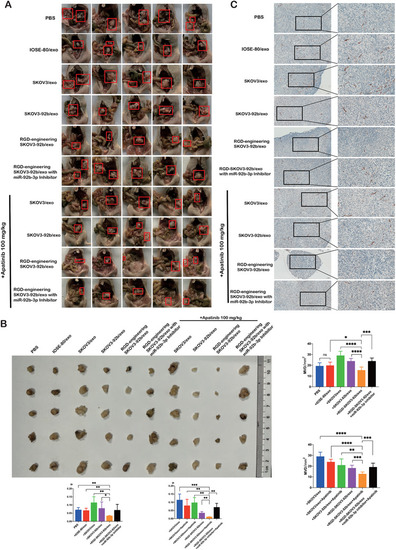
Tumor volume and angiogenesis were inhibited by engineered RGD‐SKOV3‐92b/exo alone or combined with Apatinib. (A) Gross anatomy images of nude mice in the peritoneal cavity. (B) Schematic representation of intraperitoneal xenografted tumors in different groups. Tumor size from each group was measured and weighed as represented. (C) Immunohistochemical staining of CD31 in intraperitoneal xenografted tumors (scale bar = 100 μm and 50 μm). Micro‐vessels density (MVD) was assessed by counting CD31‐positive cells (n = 5). Data are shown by at least three independent experiments. The Student's t‐test and nonparametric test were used to compare differences. *p < .05, **p < .01, ***p < .001, ****p < .0001

Acknowledgments
This image is the copyrighted work of the attributed author or publisher, and ZFIN has permission only to display this image to its users. Additional permissions should be obtained from the applicable author or publisher of the image. Full text @ Clin Transl Med