IMAGE

FIGURE 5

ID
ZDB-IMAGE-210601-18
Source
Figures for Wang et al., 2021
Image
Figure Caption

FIGURE 5

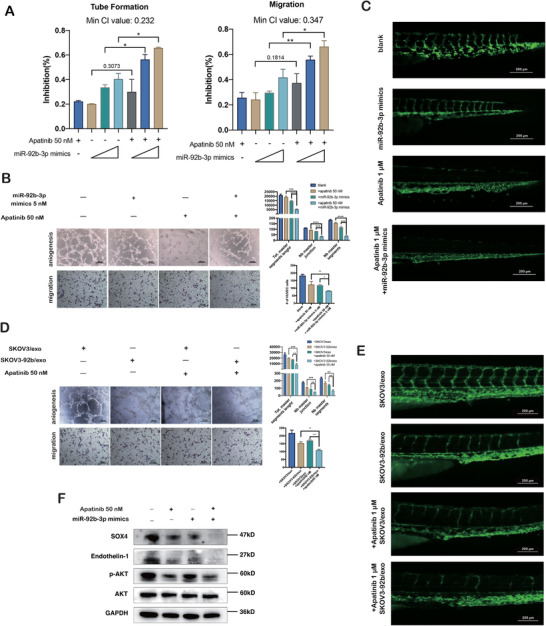
Exosomal miR‐92b‐3p and Apatinib represent the synergistic anti‐angiogenic effect. (A) Inhibition rates of tube formation and migration of HUVECs treated with Apatinib or miR‐92b‐3p mimics alone or both combined (mean ± SD, n = 3). In the Apatinib‐treated group, the working concentration was 50 nM. In the miR‐92b‐3p mimics group, the working concentrations were 1, 2, and 5 nM. In the combined Apatinib and miR‐92b‐3p mimics treated group, the working concentrations were 50 nM for Apatinib and 1, 2, and 5 nM for miR‐92b‐3p, respectively. Minimum CI values of tube formation and migration are shown. Data are shown as mean ± SD of the percentage of change when compared to full medium‐treated group (n = 3). The miR‐92b‐3p mimics treated groups were used as negative controls. (B) Representative images of tube formation and migration of HUVECs treated with Apatinib (50 nM) and miR‐92b‐3p (5 nM) (scale bar = 100 μm). Total master segments length, number of master junctions, master nodes, and migration cells were regarded as indicators of angiogenic ability in vitro and assessed by ImageJ (mean ± SD, n = 3). (C) Representative images of zebrafish embryos treated with Apatinib (1 μM), miR‐92b‐3p mimics, and Apatinib (1 μM) plus miR‐92b‐3p, respectively (scale bar = 100 μm). (D) Representative images of tube formation and migration of HUVECs treated with SKOV3/exo, SKOV3‐92b/exo, Apatinib, and SKOV3‐92b/exo plus Apatinib (mean ± SD, n = 3), respectively (scale bar = 100 μm). Total master segments length, number of master junctions, master nodes, and migration cells were regarded as indicators of angiogenic ability in vitro and assessed by ImageJ (mean ± SD, n = 3). (E) Representative images of zebrafish embryos treated with SKOV3/exo, SKOV3‐92b/exo, Apatinib, and SKOV3‐92b/exo plus Apatinib, respectively (scale bar = 200 μm). (F) Western blotting of the expression levels of SOX4, endothelin‐1, and p‐AKT treated by miR‐92b‐3p (5 nM) plus Apatinib (50 nM). Data are shown by at least three independent experiments, and the Student's t‐test was used to compare differences. *p < .05, **p < .01, ***p < .001, ****p < .0001

Acknowledgments
This image is the copyrighted work of the attributed author or publisher, and ZFIN has permission only to display this image to its users. Additional permissions should be obtained from the applicable author or publisher of the image. Full text @ Clin Transl Med