IMAGE

FIGURE 2

ID
ZDB-IMAGE-210601-15
Source
Figures for Wang et al., 2021
Image
Figure Caption

FIGURE 2

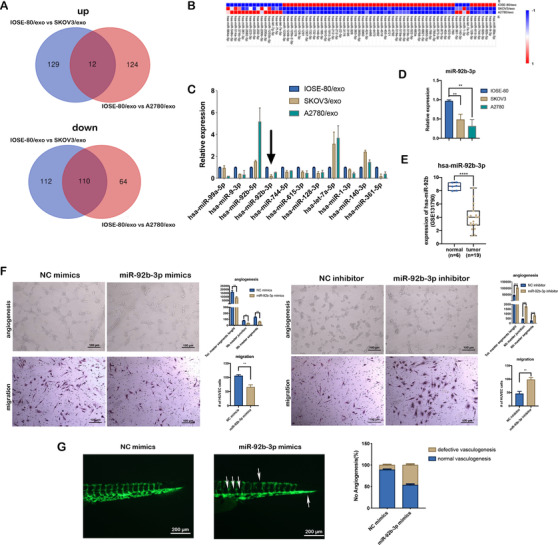
miR‐92b‐3p acts as a suppressor of tumor‐associated angiogenesis. (A) Venn diagram of the overlapping differentially expressed miRNAs (p < .05) common to two miRNA sequencings (IOSE‐80/exo vs. SKOV3/exo and IOSE‐80/exo vs. A2780/exo). (B) The heatmap of differentially expressed miRNAs (p < .05) (IOSE‐80/exo vs. SKOV3/exo and IOSE‐80/exo vs. A2780/exo). (C) qRT‐PCR validation of difference in miRNA expressions between IOSE‐80/exo and two ovarian cancer cell exosomes (mean ± SD, n = 3), data were normalized to the level of U6. Black arrow indicates miR‐92b‐3p. (D) qRT‐PCR analysis on miR‐92b‐3p expression in ovarian cancer cell lines compared to IOSE‐80 cell line (mean ± SD, n = 3), data were normalized to the level of U6. (E) Expression of miR‐92b‐3p in ovarian cancer and normal tissue samples in GSE131790 data. (F) Representative images of tube formation and migration of HUVECs transfected with miR‐92b‐3p mimics or miR‐92b‐3p inhibitor (scale bar = 100 μm), compared to the negative controls. Total master segments length, number of master junctions, master nodes, and migration cells were regarded as indicators of angiogenic ability in vitro and assessed by ImageJ (mean ± SD, n = 3). (G) Left: Representative images of trunk vasculature in Tg(fli‐1:EGFP) embryos injected with NC mimics or miR‐92b‐3p mimics (scale bar = 200 μm). Right: Percentage of defective vasculogenesis in zebrafish with NC mimics (n = 18) or miR‐92b‐3p mimics (n = 23). Data are shown by at least three independent experiments, and the Student's t‐test was used to compare differences. *p < .05, **p < .01, ***p < .001, ****p < .0001

Acknowledgments
This image is the copyrighted work of the attributed author or publisher, and ZFIN has permission only to display this image to its users. Additional permissions should be obtained from the applicable author or publisher of the image. Full text @ Clin Transl Med