
- Title
-
Differential Regulation of Ca2+-Activated Cl- Channel TMEM16A Splice Variants by Membrane PI(4,5)P2
- Authors
- Ko, W., Suh, B.C.
- Source
- Full text @ Int. J. Mol. Sci.
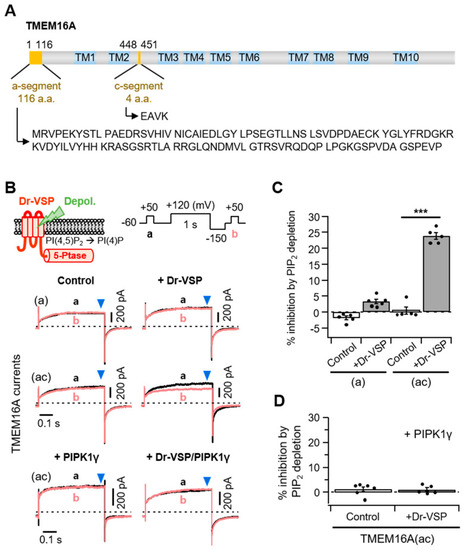
Different PI(4,5)P2 sensitivities of alternatively spliced TMEM16A(a) and TMEM16A(ac) channels. (A) Domain-architecture schematics of the TMEM16A(ac) channel consisting of two splicing segments (yellow box) and 10 transmembrane domains (TM; blue box). The numbers above the diagram indicate the amino acid positions of two segments, ?a? and ?c?, in TMEM16A. The amino acid sequences for the alternatively spliced ?a? (116 residues) and ?c? (four residues) are shown below. (B) Top: An illustration of Dr-VSP-mediated PI(4,5)P2 depletion in the plasma membrane. The inset shows the voltage protocol with a large depolarization for activating the Dr-VSP. Bottom: A comparison between the inhibition of TMEM16A(a) and TMEM16A(ac) currents by membrane depolarization in the control and Dr-VSP-expressing cells. The currents at +50 mV before (a, black) and after (b, red) 1 s depolarizing pulses to +120 mV are superimposed. The pipette solution contained 3 mM ATP and 455 nM (TMEM16A(a)) or 115 nM (TMEM16A(ac)) [Ca2+]i. (C) Summary of TMEM16A(a) and TMEM16A(ac) current inhibition (%) by membrane depolarization in the control and Dr-VSP-expressing cells. n = 5. *** p < 0.001, one-way analysis of variance (ANOVA) followed by Sidak?s post hoc test. (D) Summary of current inhibition (%) of TMEM16A(ac) by membrane depolarization in cells expressing PIPKI? alone or Dr-VSP plus PIPKI?. n = 5?6. Dots indicate the individual data points for each cell. Bars indicate means � standard error of the mean (SEM). |
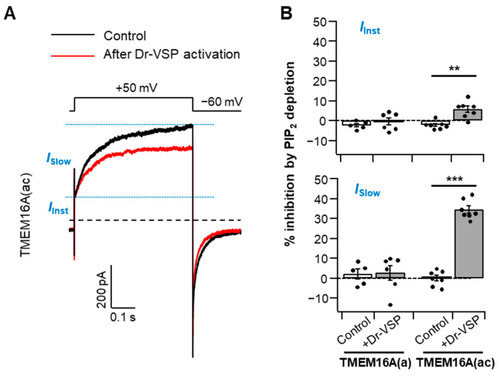
Analysis of PI(4,5)P2 regulation regarding the two steps of TMEM16A activation. (A) Representative Cl? current traces activated by a voltage step to +50 mV before (control) and after Dr-VSP activation in cells expressing TMEM16A(ac) in the presence of a 115 nM intracellular Ca2+ concentration. Black trace: control (before Dr-VSP activation). Red trace: after Dr-VSP activation. The dotted line indicates zero current. The horizontal dashed lines (blue) indicate the separation point for the instantaneous and slow currents. IInst?instantaneous Cl? current; ISlow?slow Cl? current. (B) Inhibition (%) of the instantaneous (top) and slow (bottom) currents in response to PI(4,5)P2 depletion by Dr-VSP activation in cells expressing TMEM16A(a) or TMEM16A(ac); n = 5?7. Dots indicate the individual data points for each cell. Bars indicate means � SEM. ** p < 0.01, *** p < 0.001, one-way ANOVA followed by Sidak?s post hoc test. |
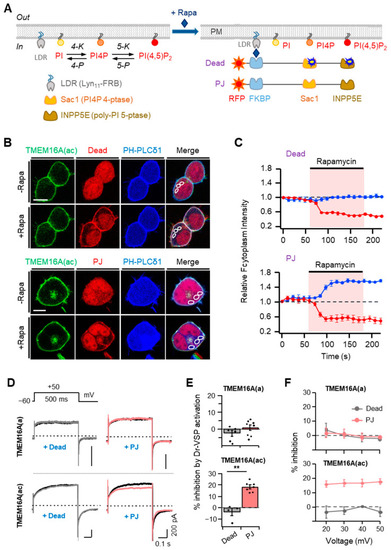
Effects of rapamycin-induced translocation of poly-phosphoinositide phosphatases on TMEM16A currents. (A) Left: metabolic pathway of PI(4,5)P2 synthesis by lipid kinases (4-K and 5-K) and breakdown by lipid phosphatases (4-P and 5-P). PI, phosphatidylinositol; PI4P, phosphatidylinositol 4-phosphate; LDR, Lyn11-FRB; Sac1, PI4P 4-phosphatase; INPP5E, poly-PI 5-phosphatase. Right: schematic diagram showing the rapamycin-induced dimerization of FRB and FKBP proteins. This dimerization leads to the recruitment of poly-PI-metabolizing enzymes to the plasma membrane. RF-Dead is a translocatable construct with inactive mutant Sac1 and INPP5E enzymes. (B) Confocal images of cells expressing RF-Dead or RF-PJ with GFP-TMEM16A(ac), CFP-PH-PLC?1, and LDR. Images were acquired before (?) and after (+) the application of rapamycin (1 ?M) for 120 s. Images are representative of three to five cells in three independent experiments. In each cell, three regions of interest were marked in confocal images for the analysis of cytosolic fluorescence intensity in a single cell. The scale bar represents 10 ?m. (C) The time course of rapamycin effects on the relative cytosolic fluorescence intensities of CFP-PH-PLC?1 (blue) and phosphatase enzymes (red). (D) Representative TMEM16A(a) (top) and TMEM16A(ac) (bottom) currents before (black trace) and after (colored trace) the addition of rapamycin (1 ?M) for 1 min in cells co-transfected with LDR and RF-Dead (gray) or RF-PJ (pink). (E) Summary of inhibition (%) in TMEM16A(a) and TMEM16A(ac) by rapamycin-induced translocation of RF-Dead or RF-PJ to the plasma membrane (TMEM16A(a): RF-Dead, n = 6, RF-PJ, n = 8; TMEM16A(ac): RF-Dead, n = 4, RF-PJ, n = 6). Dots indicate the individual data points for each cell. Bars indicate means � SEM. ** p < 0.01 compared with RF-Dead. (F) Voltage independence of the rapamycin-induced inhibition of TMEM16A(a) and TMEM16A(ac) channels. The percent inhibition is plotted as a function of the membrane potential (mV). |
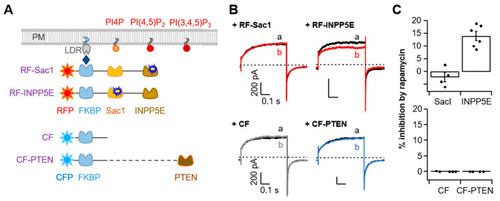
Specific TMEM16A current inhibition via the depletion of PI(4,5)P2 but not PI4P or PI(3,4,5)P3. (A) Strategy used to dephosphorylate PI4P, PI(4,5)P2, or PI(3,4,5)P3 using a rapamycin-induced dimerization system. RF-Sac1, 4-phosphatase; RF-INPP5E, 5-phosphatase; CF-PTEN, PI(3,4,5)P3 phosphatase. CF was constructed without a phosphatase enzyme. (B) Representative currents before (black trace) and after (colored trace) the addition of rapamycin (1 ?M) for 1 min in control cells co-expressing RF-Sac1, RF-INPP5E, CF, or CF-PTEN. (C) Summary of inhibition (%) in (B) by rapamycin-induced translocation of RF-Sac1, RF-INPP5E, CF, or CF-PTEN to the plasma membrane for TMEM16A(ac). Top: RF-Sac1, n = 4; RF-INPP5E, n = 7. Bottom: CF, n = 4; CF-PTEN, n = 4. Dots indicate the individual data points for each cell. Bars indicate means � SEM. |
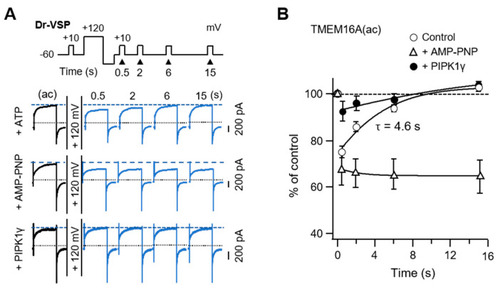
TMEM16A(ac) current recovery from inhibition by PI(4,5)P2 depletion. (A) Current traces for TMEM16A(ac) in control cells intracellularly perfused with 3 mM ATP (top), cells perfused with AMP-PNP (middle), and cells expressing PIPKI? with 3 mM ATP (bottom) before and after a +120 mV 1 s depolarizing pulse. TMEM16A(ac) currents were measured at +50 mV at the indicated times after the depolarizing pulse. Dotted lines indicate a zero current; dashed lines indicate the initial TMEM16A(ac) current before the depolarizing step. (B) Summary time courses of TMEM16A(ac) current recovery in response to PI(4,5)P2 depletion by Dr-VSP activation (ATP, n = 6; AMP-PNP, n = 5; PIPKI?, n = 5). |
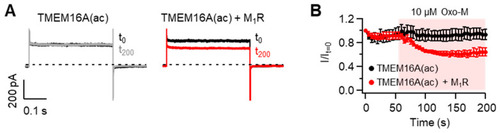
Modulation of TMEM16A(ac) channels by the M1 muscarinic receptor (M1R). (A) Representative Cl? current traces of TMEM16A(ac) before and after application of the M1R agonist oxotremorine-M (Oxo-M). Whole-cell recordings were measured before (t0, black) and 200 s after (t200, gray and red) the application of 10 ?M Oxo-M in cells co-transfected without (left) and with (right) M1R. Cells were dialyzed with an intracellular solution including 10 mM EGTA and zero Ca2+, and the current was measured at +100 mV every 5 s. (B) Normalized mean current � SEM. TMEM16A(ac), n = 5; TMEM16A(ac) + M1R, n = 5. |