
|
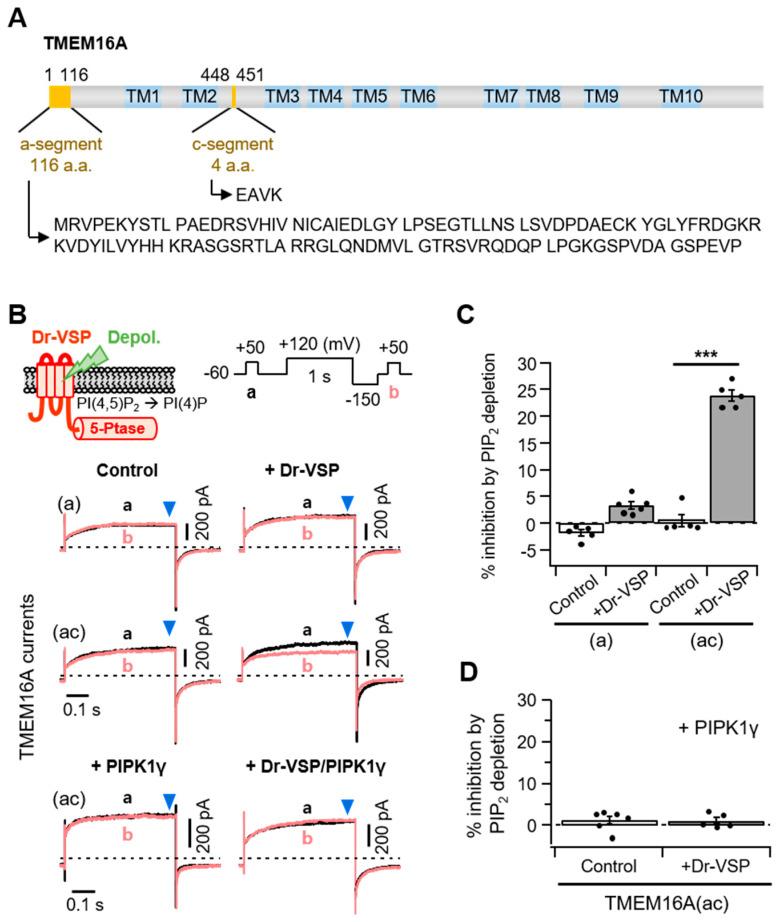
Figure 1 Different PI(4,5)P2 sensitivities of alternatively spliced TMEM16A(a) and TMEM16A(ac) channels. (A) Domain-architecture schematics of the TMEM16A(ac) channel consisting of two splicing segments (yellow box) and 10 transmembrane domains (TM; blue box). The numbers above the diagram indicate the amino acid positions of two segments, “a” and “c”, in TMEM16A. The amino acid sequences for the alternatively spliced “a” (116 residues) and “c” (four residues) are shown below. (B) Top: An illustration of Dr-VSP-mediated PI(4,5)P2 depletion in the plasma membrane. The inset shows the voltage protocol with a large depolarization for activating the Dr-VSP. Bottom: A comparison between the inhibition of TMEM16A(a) and TMEM16A(ac) currents by membrane depolarization in the control and Dr-VSP-expressing cells. The currents at +50 mV before (a, black) and after (b, red) 1 s depolarizing pulses to +120 mV are superimposed. The pipette solution contained 3 mM ATP and 455 nM (TMEM16A(a)) or 115 nM (TMEM16A(ac)) [Ca2+]i. (C) Summary of TMEM16A(a) and TMEM16A(ac) current inhibition (%) by membrane depolarization in the control and Dr-VSP-expressing cells. n = 5. *** p < 0.001, one-way analysis of variance (ANOVA) followed by Sidak’s post hoc test. (D) Summary of current inhibition (%) of TMEM16A(ac) by membrane depolarization in cells expressing PIPKIγ alone or Dr-VSP plus PIPKIγ. n = 5–6. Dots indicate the individual data points for each cell. Bars indicate means ± standard error of the mean (SEM).