
Figure 2
- ID
- ZDB-FIG-210503-91
- Publication
- Ko et al., 2021 - Differential Regulation of Ca2+-Activated Cl- Channel TMEM16A Splice Variants by Membrane PI(4,5)P2
- Other Figures
- All Figure Page
- Back to All Figure Page
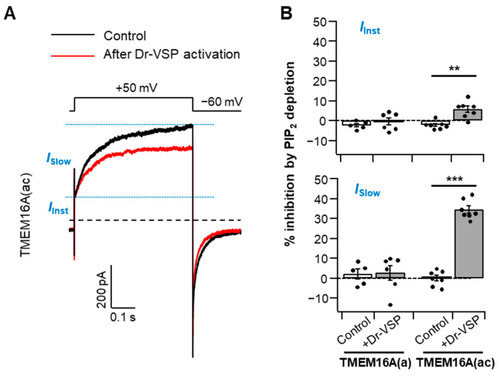
Analysis of PI(4,5)P2 regulation regarding the two steps of TMEM16A activation. (A) Representative Cl− current traces activated by a voltage step to +50 mV before (control) and after Dr-VSP activation in cells expressing TMEM16A(ac) in the presence of a 115 nM intracellular Ca2+ concentration. Black trace: control (before Dr-VSP activation). Red trace: after Dr-VSP activation. The dotted line indicates zero current. The horizontal dashed lines (blue) indicate the separation point for the instantaneous and slow currents. IInst—instantaneous Cl− current; ISlow—slow Cl− current. (B) Inhibition (%) of the instantaneous (top) and slow (bottom) currents in response to PI(4,5)P2 depletion by Dr-VSP activation in cells expressing TMEM16A(a) or TMEM16A(ac); n = 5–7. Dots indicate the individual data points for each cell. Bars indicate means ± SEM. ** p < 0.01, *** p < 0.001, one-way ANOVA followed by Sidak’s post hoc test. |