
|
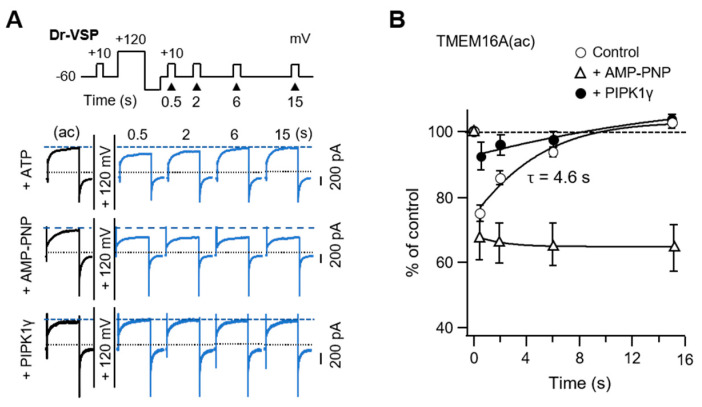
Figure 5 TMEM16A(ac) current recovery from inhibition by PI(4,5)P2 depletion. (A) Current traces for TMEM16A(ac) in control cells intracellularly perfused with 3 mM ATP (top), cells perfused with AMP-PNP (middle), and cells expressing PIPKIγ with 3 mM ATP (bottom) before and after a +120 mV 1 s depolarizing pulse. TMEM16A(ac) currents were measured at +50 mV at the indicated times after the depolarizing pulse. Dotted lines indicate a zero current; dashed lines indicate the initial TMEM16A(ac) current before the depolarizing step. (B) Summary time courses of TMEM16A(ac) current recovery in response to PI(4,5)P2 depletion by Dr-VSP activation (ATP, n = 6; AMP-PNP, n = 5; PIPKIγ, n = 5).