
- Title
-
Hemodynamic Forces Regulate Cardiac Regeneration-Responsive Enhancer Activity during Ventricle Regeneration
- Authors
- Geng, F., Ma, J., Li, X., Hu, Z., Zhang, R.
- Source
- Full text @ Int. J. Mol. Sci.
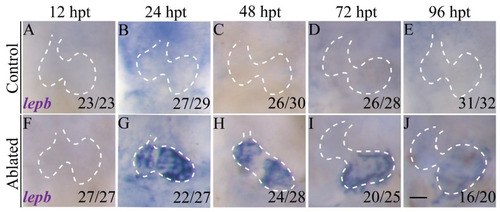
lepb is induced during zebrafish larval ventricle regeneration. (A–J) Whole-mount in situ hybridizations showed that lepb expression was upregulated in ablated hearts of Tg(vmhc:mCherry-NTR) fish compared to control hearts. Scale bar, 25 μm. Dashed lines outline the hearts. Numbers indicate the ratio of representative staining observed. hpt, hours post treatment. NTR, nitroreductase. |
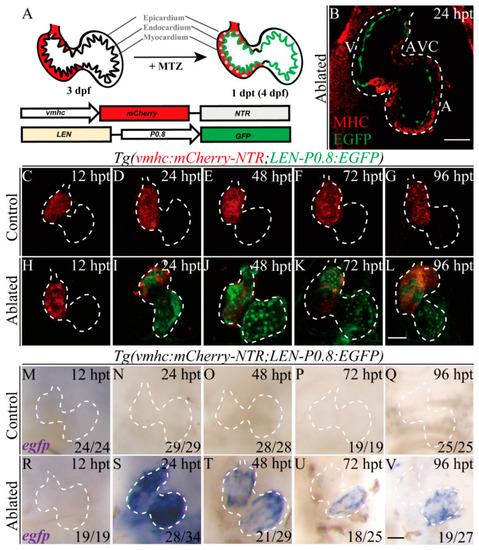
LEN is activated in the endocardium during ventricle regeneration. (A) Schematic diagrams of the transgenic constructs and ventricular ablation process of Tg(vmhc:mCherry-NTR; LEN-P0.8:EGFP) fish. (B) Confocal optical section image showed enhancer-directed fluorescence (green) in the endocardium of ablated Tg(vmhc:mCherry-NTR; LEN-P0.8:EGFP) hearts at 24 hpt. Red, MHC immunostaining by MF20. A, atrium; AVC, atrioventricular canal; MHC, myosin heavy chain; V, ventricle. (C–L) Confocal stack projections showed enhancer-directed fluorescence (green) dramatically increased in ablated hearts of Tg(vmhc:mCherry-NTR; LEN-P0.8:EGFP) fish compared to control hearts. (M–V) Whole-mount in situ hybridizations showed dynamic egfp expression in ablated hearts of Tg(vmhc:mCherry-NTR; LEN-P0.8:EGFP) compared to control hearts. Scale bars, (B–L) 50 μm, (M–V) 25 μm. Dashed lines outline the hearts. Numbers indicate the ratio of representative staining observed. dpf, days post fertilization; hpt, hours post treatment. |
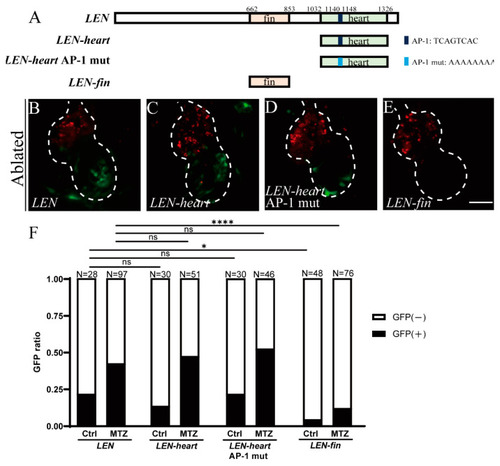
Transient analysis of enhancer activity for LEN motifs. (A) Schematic diagrams of full-length LEN, LEN-heart, LEN-heart with AP-1 mutation and LEN-fin elements. The original and mutated sequences of the predicted AP-1 binding site are also indicated. (B–E) Confocal stack projections of ablated hearts at 24 hpt from larvae injected with LEN (B), LEN-heart (C), LEN-heart AP-1 mut (D) and LEN-fin (E) constructs. (F) Quantification of the EGFP ratio of control and ablated hearts in LEN, LEN-heart, LEN-heart AP-1 mut and LEN-fin injected groups at 24 hpt. N = 28, 97, 30, 51, 30, 46, 48, 76, respectively. Chi-Square Test, ns, not significant, *, p < 0.05, ****, p < 0.0001. Scale bar, 50 μm. Dashed lines outline the hearts. hpt, hours post treatment. |

Activation of LEN is attenuated by hemodynamic force alteration. (A) Schematic timeline diagram of MO injection and MTZ treatment. (B,C) Confocal stack projections of ablated Tg(vmhc:mCherry-NTR; LEN-P0.8:EGFP) hearts in Ctrl MO (B) and tnnt2a MO (C) injected groups at 24 hpt. (D) Quantification of the EGFP ratio of control and ablated hearts in Ctrl MO and tnnt2a MO injected groups at 24 hpt. N = 72, 85, 62, 59, respectively. Fisher’s Exact Test (2X3), ****, p < 0.0001. (E) Schematic timeline diagram of MTZ treatment and hemodynamic alteration. (F–H) Confocal stack projections of ablated Tg(vmhc:mCherry-NTR; LEN-P0.8:EGFP) hearts in Control (F), Tricaine (G), and BDM (H) treated groups at 24 hpt. (I) Quantification of the EGFP ratio of control and ablated hearts in control, Tricaine, and BDM treated groups at 24 hpt. N = 80, 145, 77, 236, 55, 137, respectively. Fisher’s Exact Test (2X3), **, p < 0.01, ****, p < 0.0001. (J) Quantification of the regeneration ratio of ablated hearts in control, Tricaine, and BDM treated groups at 96 hpt. N = 224 (160 strong + 64 weak EGFP signal), 107 (44 + 63), 50 (21 + 29), respectively. Chi-Square Test, *, p < 0.05, ***, p < 0.001, ****, p < 0.0001. Scale bars, 50 μm. Dashed lines outline the hearts. dpf, days post fertilization; hpt, hours post treatment; MO, morpholino; MTZ, metronidazole. |

Primary cilia, mechanosensitive ion channel, and Notch signaling influence |
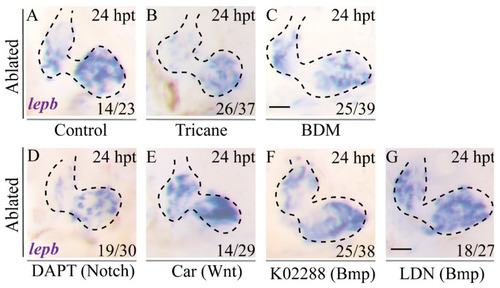
Inhibition of blood flow and Notch signaling attenuates lepb induction during ventricle regeneration. (A–G) Whole-mount in situ hybridizations showed that lepb expression in ablated hearts of Tg(vmhc:mCherry-NTR) fish at 24 hpt (A) was reduced in the Tricaine- and BDM-treated groups (B,C) and in the DAPT-treated group (D), slightly enhanced in the Car-treated group (E), and remained unchanged in the K02288- and LDN-treated groups (F,G). Scale bars, 25 μm. Dashed lines outline the hearts. Numbers indicate the ratio of representative staining observed. hpt, hours post treatment; Car, Cardiomogen-1; LDN, LDN193189. |