IMAGE

Figure 5

ID
ZDB-IMAGE-210503-82
Source
Figures for Geng et al., 2021
Image
Figure Caption

Figure 5

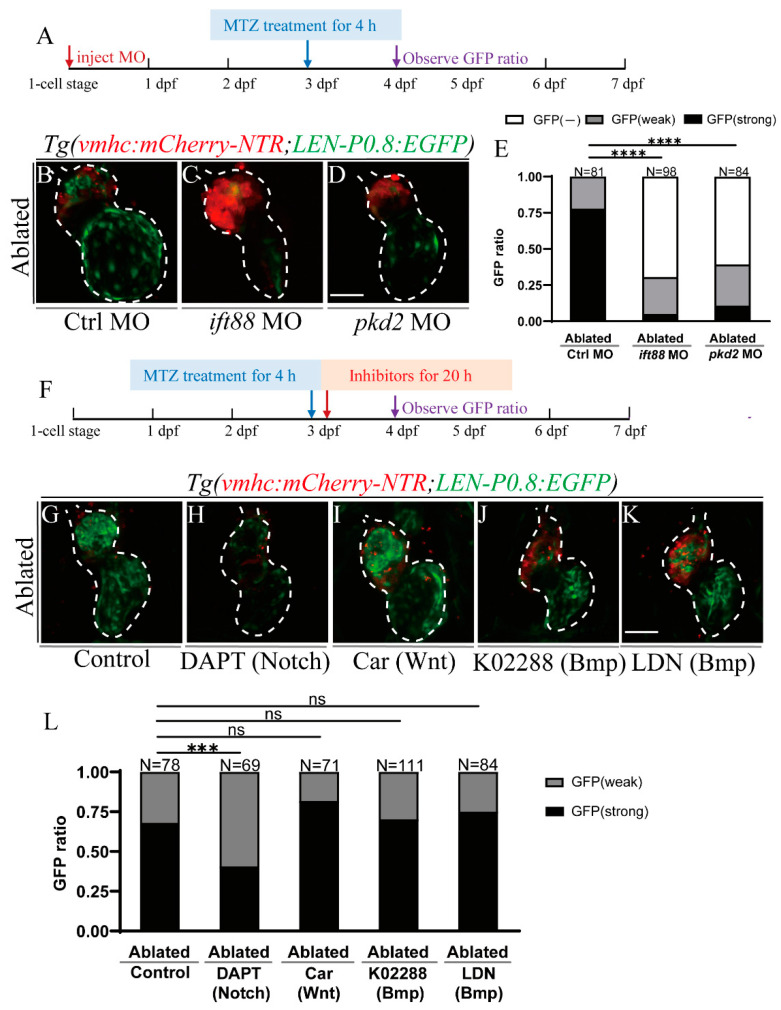
Primary cilia, mechanosensitive ion channel, and Notch signaling influence LEN activity. (A) Schematic timeline diagram of MO injection and MTZ treatment. (BD) Confocal stack projections of ablated Tg(vmhc:mCherry-NTR; LEN-P0.8:EGFP) hearts in Ctrl MO (B), ift88 MO (C) and pkd2 MO (D) injected groups at 24 hpt. (E) Quantification of EGFP ratio of ablated hearts in Ctrl MO, ift88 MO and pkd2 MO injected groups at 24 hpt. N = 81, 98, 84, respectively. Fisher’s Exact Test (2X3), ****, p < 0.0001. (F) Schematic timeline diagram of MTZ treatment and signaling pathway inhibition. (GK) Confocal stack projections of ablated Tg(vmhc:mCherry-NTR; LEN-P0.8:EGFP) hearts in control (G), DAPT (H), Car (I), K02288 (J) and LDN (K) treated groups at 24 hpt. (L) Quantification of EGFP ratio of ablated hearts in control, DAPT, Car, K02288 and LDN treated groups at 24 hpt. N = 78, 69, 71, 111, 84, respectively. Fisher’s Exact Test (2X3), ns, not significant, ***, p < 0.001. Scale bars, 50 μm. Dashed lines outline the hearts. dpf, days post fertilization; hpt, hours post treatment; Car, Cardiomogen-1; LDN, LDN193189; MO, morpholino; MTZ, metronidazole.

Acknowledgments
This image is the copyrighted work of the attributed author or publisher, and ZFIN has permission only to display this image to its users. Additional permissions should be obtained from the applicable author or publisher of the image. Full text @ Int. J. Mol. Sci.