
- Title
-
Modulation of Innate Immune Toxicity by Silver Nanoparticle Exposure and the Preventive Effects of Pterostilbene
- Authors
- Chen, R.J., Huang, C.C., Pranata, R., Lee, Y.H., Chen, Y.Y., Wu, Y.H., Wang, Y.J.
- Source
- Full text @ Int. J. Mol. Sci.
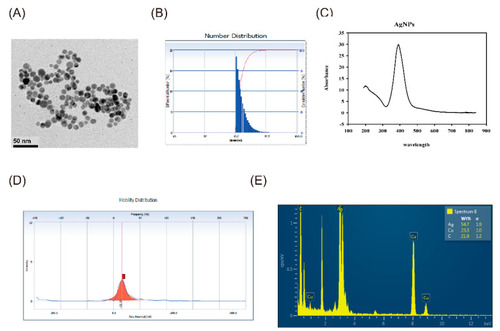
Characterization of Silver nanoparticles (AgNPs). (A) Transmission electron microscopy [18] analysis revealed that the synthesized citrate-capped AgNPs were all spherical in shape (scale bar = 50 nm). (B) The mean hydrodynamic size of the AgNPs determined by dynamic light scattering (DLS) is 13.2 ± 3.1 nm. The mean size of AgNPs was 8.89 ± 1.68 nm. (C) AgNPs were characterized by UV-visible absorption spectra and showed maximum absorbance at 391 nm. (D) The zeta potential was observed as a sharp peak at −28.85 mV. (E) The energy dispersive X-ray (EDX) spectrum showed that the main components of the NPs are silver. |
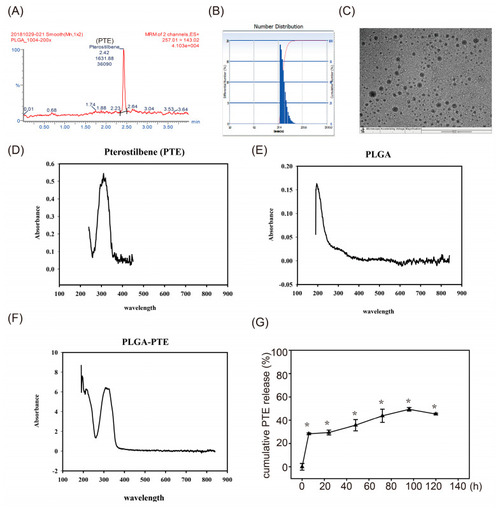
Physicochemical properties of poly(lactic-co-glycolic acid)-pterostilbene (PLGA-PTE). (A) HPLC chromatogram of PLGA-PTE (B) Transmission electron microscopy analysis revealed that all of the synthesized PLGA-PTE was spherical in shape (scale bar = 500 nm). (C) The mean hydrodynamic size of PLGA-PTE determined by dynamic light scattering (DLS) is 56.9 ± 13.6 nm and the polydispersity index (PI) is 0.155. The following figures are the UV-Vis absorption spectra of (D) PTE, (E) PLGA, and (F) PLGA-PTE. Comparison of the visible light absorption spectrum of UV light confirmed that PLGA-PTE was successfully synthesized. (G) The cumulative drug release of PTE from PLGA NPs formulation at different time points was detected by UV-Vis spectrophotometer at 310 nm. Triangle symbol indicated the PTE concentration released in water. The data are presented as the mean ± standard deviation of three independent experiments.* p < 0.05 compared with 0 h groups. |

The survival rate of zebrafish embryos. The survival rate of zebrafish embryos exposed to (A) AgNPs (0, 0.1, 0.2, 0.3, 0.4, 0.5 μg/mL) for 0, 24, 48, 72, 96, and 120 h post fertilization (hpf) (n = 30). The data are presented as the mean ± standard deviation of three independent experiments. (B) Survival rate of zebrafish embryos exposed to control, 0.3 μg/mL PLGA-PTE, PLGA-PTE + AgNPs (0.3 μg/mL PLGA-PTE pretreated for 1 h then changed to 0.3 μg/mL AgNPs), or 0.3 μg/mL AgNPs for the indicated time points (n = 30). In every treated group, the exposure solutions were replaced every day. The data are presented from at least three independent experiments. * p < 0.05, PLGA-PTE versus control groups; # p < 0.05, PLGA-PTE + AgNPs versus AgNPs groups; † p < 0.05, AgNPs groups versus control groups. (C) Appearance of the zebrafish embryos after exposure to control, 0.3 μg/mL AgNPs, PLGA-PTE + AgNPs, and 0.3 μg/mL PLGA-PTE for 48 and 72 hpf under the microscope. |
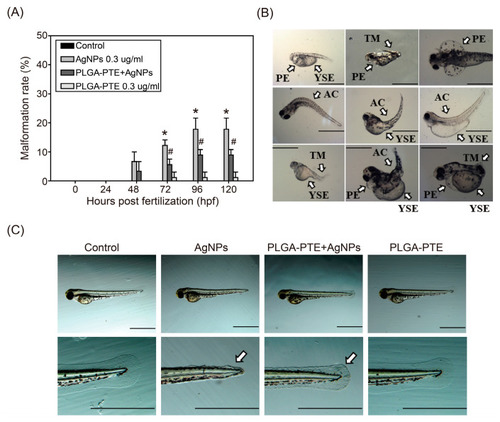
Malformation of zebrafish in response to treatment of AgNPs. (A) Malformation percentage of zebrafish embryos after exposure to control, 0.3 μg/mL AgNPs, PLGA-PTE + AgNPs, and 0.3 μg/mL PLGA-PTE for the indicated time points. The data are presented from at least three independent experiments (n = 30). * p < 0.05, AgNPs groups versus control groups; # p < 0.05, PLGA-PTE + AgNPs versus AgNPs groups; (B) Malformations of zebrafish embryos caused by AgNPs. PE, pericardial edema; YSE, yolk sac edema; AC, axial curvature; TM, tail malformation. (C) Zebrafish embryos after exposure to control, 0.3 μg/mL AgNPs, PLGA-PTE + AgNPs, and 0.3 μg/mL PLGA-PTE for 72 hpf. White arrows showed the malformation of caudal fins. Scale bar = 1.0 mm. |

The number and distribution of zebrafish neutrophils and macrophages observed under a stereo fluorescence microscope at 3 dpf and 5 dpf. Zebrafish embryos after exposure to control, 0.3 μg/mL AgNPs, PLGA-PTE + AgNPs, and 0.3 μg/mL PLGA-PTE for 3 and 5 dpf. (A) The green fluorescence image shows neutrophils and (C) macrophages, which are shown by red fluorescence Scale bar=1.0 mm.. The quantification of fluorescence imaging is shown in (B,D). The image presented is representative of three independent experiments (n = 3). * p < 0.05, AgNPs groups versus control groups; # p < 0.05, PLGA-PTE + AgNPs versus AgNPs groups. |
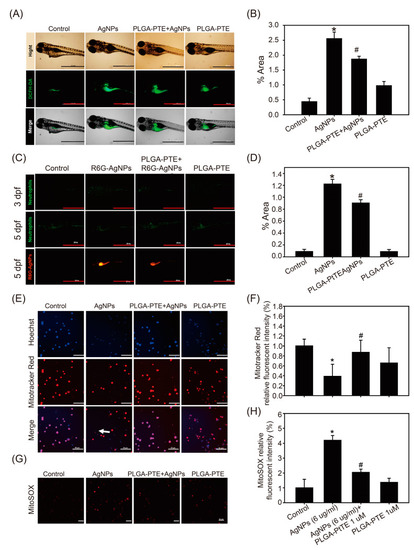
R6G-AgNPs accumulated in zebrafish and affected reactive oxygen species (ROS) production. (A) Zebrafish embryos after exposure to control, 0.3 μg/mL AgNPs, PLGA-PTE + AgNPs, and 0.3 μg/mL PLGA-PTE for 120 hpf. Then, ROS formation was shown by staining with DCFH-DA fluorescence dye for 30 min. (C) R6G-AgNPs were used to determine the content of AgNPs in zebrafish embryos. Scale bar = 1.0 mm.The fluorescence intensity was quantified in (B,D). The image presented is representative of three independent experiments (n = 3). (E) Mitochondrial damage was detected by staining with MitoTracker™ Red (loss of mitochondria membrane potential) and (G) MitoSOX™ (indicated ROS production) in THP-1 cells after each treatment for 6 h. The white arrow indicated the cells with damaged mitochondria that was lack of staining with Mitotracker. Scale bar= 50 μm. (F,H) The image was quantified and presented as the representative of three independent experiments (n = 3). * p < 0.05, AgNPs groups versus control groups; # p < 0.05, PLGA-PTE + AgNPs versus AgNPs groups. |
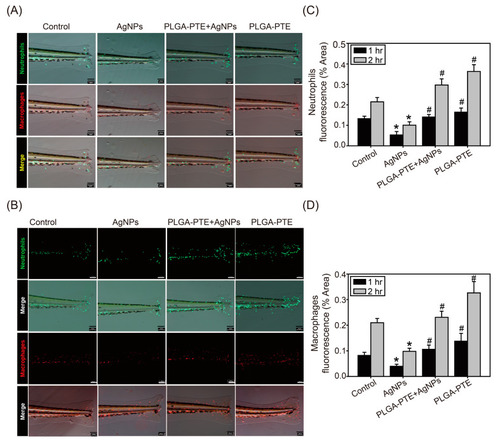
AgNPs exposure affected the accumulation of neutrophils and macrophages in the wounded tail. Zebrafish embryos after exposure to control, 0.3 μg/mL AgNPs, PLGA-PTE + AgNPs, and 0.3 μg/mL PLGA-PTE for 120 h. After the transgenic zebrafish Tg(mpx:eGFP):Neutrophils and Tg(mpeg1:mCherry):Macrophages were anesthetized, their tail fins were transected at the end of the spinal cord with a sterile blade under a microscope. The reverse migration of the immune cells was observed under a fluorescence microscope after (A) 1 h and (B) 2 h of transection. Scale bar= 100 μm. The image was quantified as (C) and (D) and the presented is representative of three independent experiments (n = 3). * p < 0.05, AgNPs groups versus control groups; # p < 0.05, PLGA-PTE + AgNPs versus AgNPs groups. |
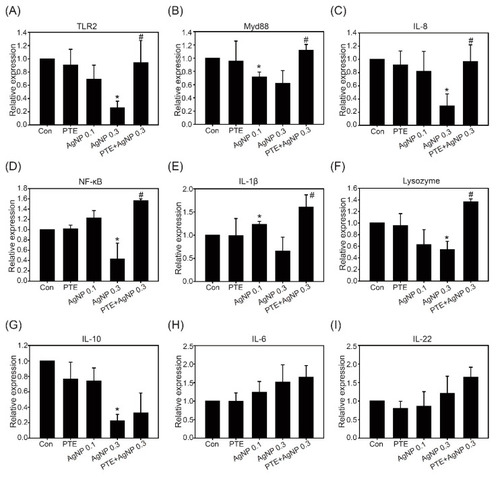
Expression of immune-related genes after 5 dpf exposure. Zebrafish embryos after exposure to control, 0.3 μg/mL PLGA-PTE, 0.1 μg/mL AgNPs, 0.3 μg/mL AgNPs, and PLGA-PTE + AgNPs for 120 hpf. Then, the genes from whole larvae, including: (A) Toll-like receptors 2 (TLR2), (B) Myd88, (C) IL-8, (D) NF-κB, (E) IL-1β, (F) Lysozyme, (G) IL-10, (H) IL-6, and (I) IL-22, were analyzed. β-actin served as the internal control. The data are presented from at least three independent experiments. * p < 0.05, AgNPs groups versus control groups; # p < 0.05, PLGA-PTE + AgNPs versus AgNPs groups. |