
|
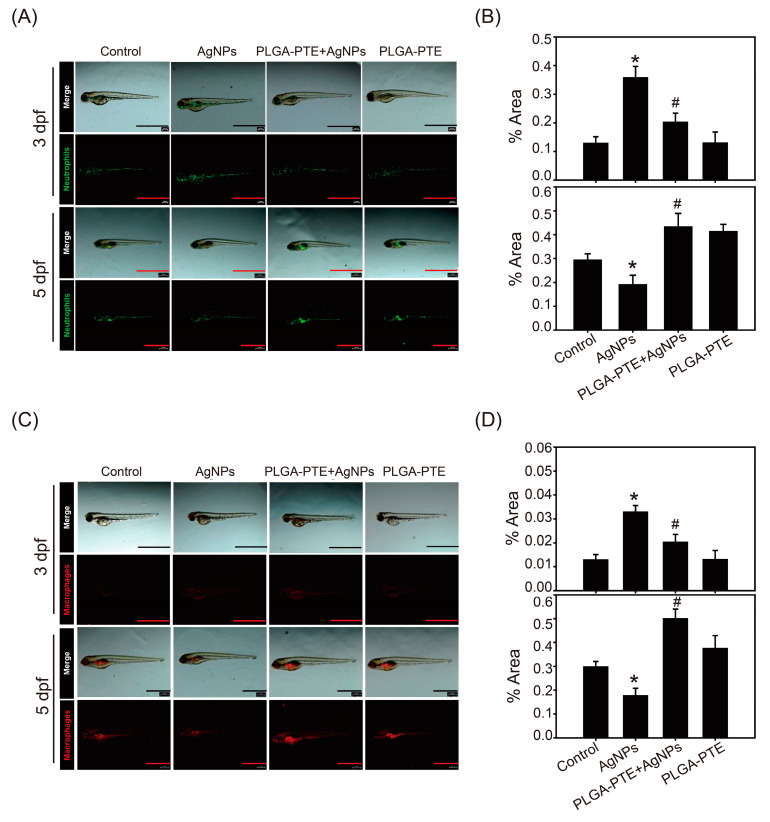
Figure 5 The number and distribution of zebrafish neutrophils and macrophages observed under a stereo fluorescence microscope at 3 dpf and 5 dpf. Zebrafish embryos after exposure to control, 0.3 μg/mL AgNPs, PLGA-PTE + AgNPs, and 0.3 μg/mL PLGA-PTE for 3 and 5 dpf. (A) The green fluorescence image shows neutrophils and (C) macrophages, which are shown by red fluorescence Scale bar=1.0 mm.. The quantification of fluorescence imaging is shown in (B,D). The image presented is representative of three independent experiments (n = 3). * p < 0.05, AgNPs groups versus control groups; # p < 0.05, PLGA-PTE + AgNPs versus AgNPs groups.