
|
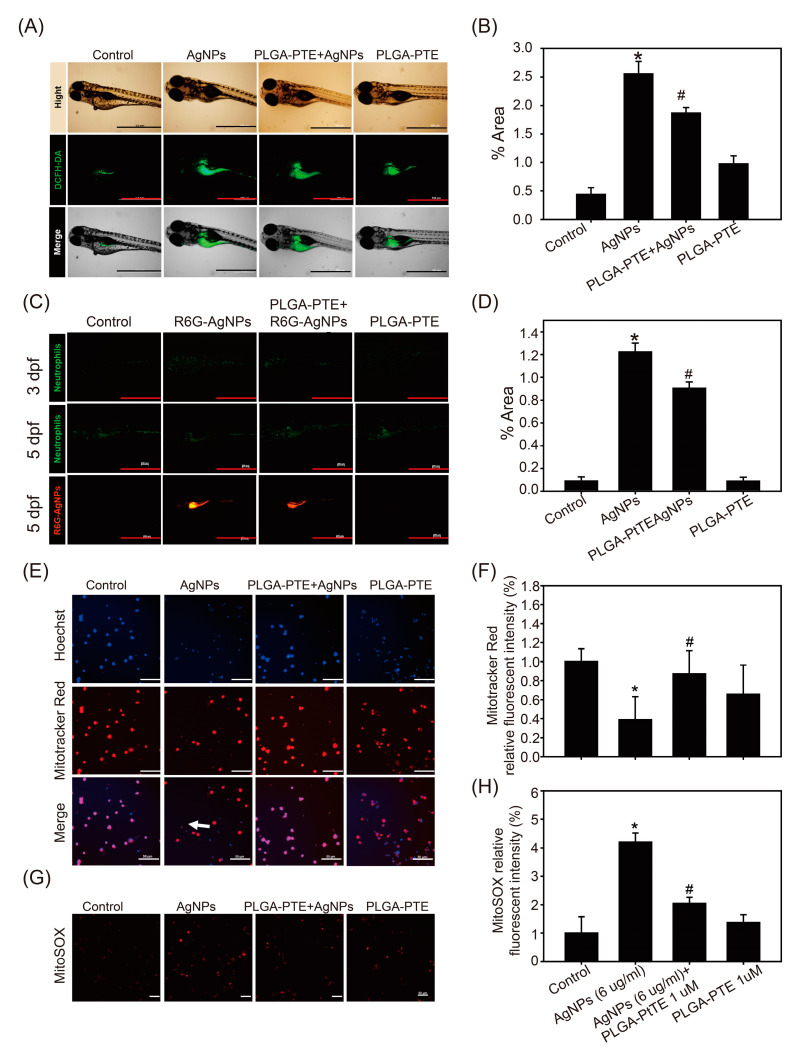
Figure 6 R6G-AgNPs accumulated in zebrafish and affected reactive oxygen species (ROS) production. (A) Zebrafish embryos after exposure to control, 0.3 μg/mL AgNPs, PLGA-PTE + AgNPs, and 0.3 μg/mL PLGA-PTE for 120 hpf. Then, ROS formation was shown by staining with DCFH-DA fluorescence dye for 30 min. (C) R6G-AgNPs were used to determine the content of AgNPs in zebrafish embryos. Scale bar = 1.0 mm.The fluorescence intensity was quantified in (B,D). The image presented is representative of three independent experiments (n = 3). (E) Mitochondrial damage was detected by staining with MitoTracker™ Red (loss of mitochondria membrane potential) and (G) MitoSOX™ (indicated ROS production) in THP-1 cells after each treatment for 6 h. The white arrow indicated the cells with damaged mitochondria that was lack of staining with Mitotracker. Scale bar= 50 μm. (F,H) The image was quantified and presented as the representative of three independent experiments (n = 3). * p < 0.05, AgNPs groups versus control groups; # p < 0.05, PLGA-PTE + AgNPs versus AgNPs groups.