
|
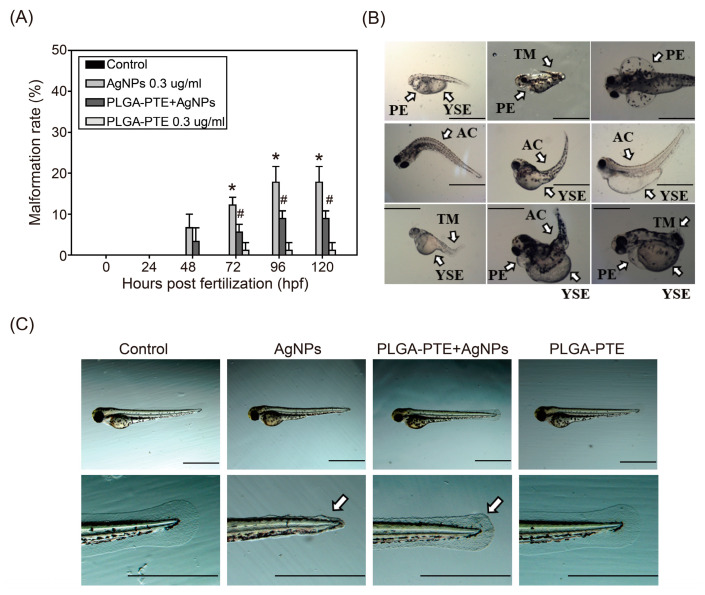
Figure 4 Malformation of zebrafish in response to treatment of AgNPs. (A) Malformation percentage of zebrafish embryos after exposure to control, 0.3 μg/mL AgNPs, PLGA-PTE + AgNPs, and 0.3 μg/mL PLGA-PTE for the indicated time points. The data are presented from at least three independent experiments (n = 30). * p < 0.05, AgNPs groups versus control groups; # p < 0.05, PLGA-PTE + AgNPs versus AgNPs groups; (B) Malformations of zebrafish embryos caused by AgNPs. PE, pericardial edema; YSE, yolk sac edema; AC, axial curvature; TM, tail malformation. (C) Zebrafish embryos after exposure to control, 0.3 μg/mL AgNPs, PLGA-PTE + AgNPs, and 0.3 μg/mL PLGA-PTE for 72 hpf. White arrows showed the malformation of caudal fins. Scale bar = 1.0 mm.