
|
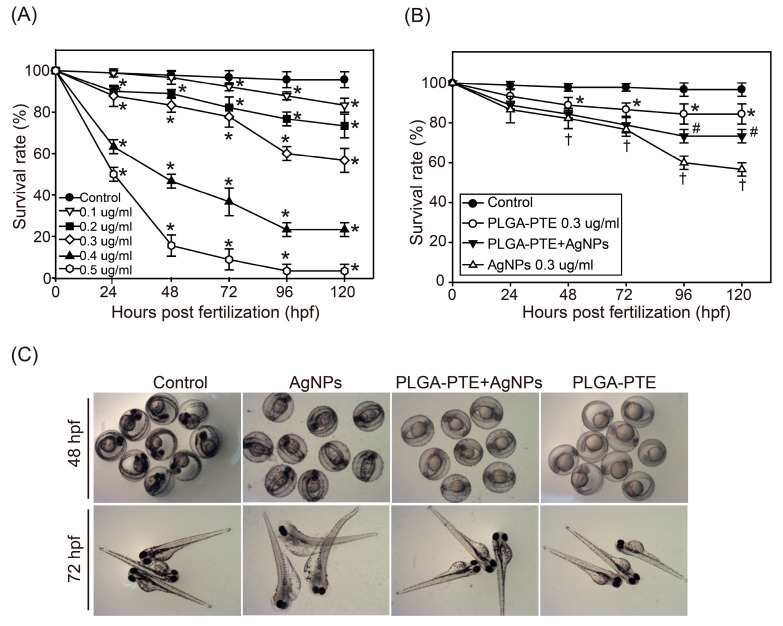
Figure 3 The survival rate of zebrafish embryos. The survival rate of zebrafish embryos exposed to (A) AgNPs (0, 0.1, 0.2, 0.3, 0.4, 0.5 μg/mL) for 0, 24, 48, 72, 96, and 120 h post fertilization (hpf) (n = 30). The data are presented as the mean ± standard deviation of three independent experiments. (B) Survival rate of zebrafish embryos exposed to control, 0.3 μg/mL PLGA-PTE, PLGA-PTE + AgNPs (0.3 μg/mL PLGA-PTE pretreated for 1 h then changed to 0.3 μg/mL AgNPs), or 0.3 μg/mL AgNPs for the indicated time points (n = 30). In every treated group, the exposure solutions were replaced every day. The data are presented from at least three independent experiments. * p < 0.05, PLGA-PTE versus control groups; # p < 0.05, PLGA-PTE + AgNPs versus AgNPs groups; † p < 0.05, AgNPs groups versus control groups. (C) Appearance of the zebrafish embryos after exposure to control, 0.3 μg/mL AgNPs, PLGA-PTE + AgNPs, and 0.3 μg/mL PLGA-PTE for 48 and 72 hpf under the microscope.