FIGURE SUMMARY
Title

Three-dimensional collagen-based scaffold model to study the microenvironment and drug-resistance mechanisms of oropharyngeal squamous cell carcinomas

Authors
Miserocchi, G., Cocchi, C., De Vita, A., Liverani, C., Spadazzi, C., Calpona, S., Di Menna, G., Bassi, M., Meccariello, G., De Luca, G., Campobassi, A., Maddalena Tumedei, M., Bongiovanni, A., Fausti, V., Cotelli, F., Ibrahim, T., Mercatali, L.
Source
Full text @ Cancer Biol Med

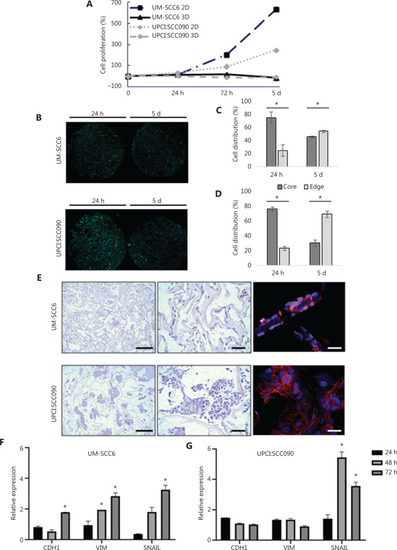
Characterization of the 3D oropharyngeal squamous cell carcinoma culture model. (A) Fold changes in percentage of cell proliferation (relative to hour 0) of UM-SCC6 and UPCI:SCC090 in monolayer (2D) and in scaffolds (3D) after 24 h, 72 h, and 5 days. (B) Whole images of histological sections of scaffold cultured with UM-SCC6 and UPCI:SCC090 on days 1 and 5. Cells are stained with DAPI (blue) and green is the collagen scaffold autofluorescence. Scale bars: 1 mm. (C, D) Cell percentage in the core and at the edge of the scaffold area. Data represent mean ± standard deviation. *P < 0.05, 2-tailed Student’s t-test. (E) Images of H&E-stained histological sections and confocal images of UM-SCC6 and UPCI:SCC090 scaffold cultures. From above: H&E images at 4× magnification (scale bars: 100 µm) and 20× magnification (scale bars: 50 µm); confocal images of sections stained with phalloidin in red and DAPI in blue (scale bar: 20 µm). (F, G) CDH1, VIM, and SNAIL relative mRNA expression in UM-SCC6 and UPCI:SCC090 within the scaffold vs. 2D cultures after 24, 48, and 72 h. Data represent mean ± standard deviation. *P < 0.05, 2-tailed Student’s t-test. 3D, 3-dimensional; 2D, 2-dimensional; H&E, hematoxylin and eosin; DAPI, 4′,6-diamidino-2-phenylindole.

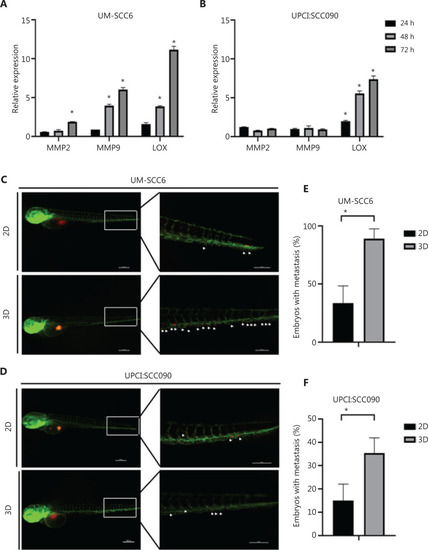
Cells cultured in the scaffold interact with collagen fiber network and display higher cell migration inside the vessels of zebrafish embryos. (A, B) UM-SCC6 and UPCI:SCC090 relative expression levels of MMP2, MMP9, and LOX in 3D vs. 2D cultures after 24 h, 48 h, and 72 h. Data represent mean ± standard deviation. *P < 0.05, 2-tailed Student’s t-test. (C, D) Representative pictures of Tg(fli1:EGFP) embryos injected with UM-SCC6 and UPCI:SCC090 recovered from 2D and 3D cultures and labeled with a red fluorescent dye (CM-Dil). The images show the whole embryo body and tail region details at 24 hpi. The white asterisks show single or small cell clusters. (E, F) Percentage of embryos showing distant micrometastases. Data represent mean ± standard error. *P < 0.05, 2-tailed Student’s t-test. 3D, 3-dimensional; 2D, 2-dimensional.

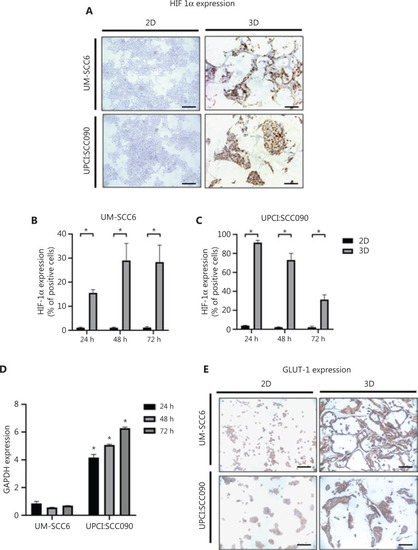
3D microenvironment induces hypoxic and glycolytic adaptation by oropharyngeal squamous cell carcinoma cells. (A) Representative images of HIF-1α-stained cytospinned cells and histological sections of 2D and 3D cultures (scale bar: 50 µm). (B, C) Percentage of HIF-1α-positive cells in 2D and 3D cultures of UM-SCC6 and UPCI:SCC090 after 24, 48, and 72 h. Data represent mean ± standard deviation. *P < 0.05, 2-tailed Student’s t-test. (D) GAPDH mRNA expression levels in 3D vs. 2D cultures after 24, 48, and 72 h. Data represent mean ± standard deviation. *P < 0.05, 2-tailed Student’s t-test. (E) Representative images of GLUT-1-stained cytospinned cells and histological sections of 2D and 3D cultures (scale bar: 50 µm). 3D, 3-dimensional; HIF-1α, hypoxia-inducible factor 1α; 2D, 2-dimensional; GAPDH, glyceraldehyde 3-phosphate dehydrogenase; GLUT-1, glucose transporter.

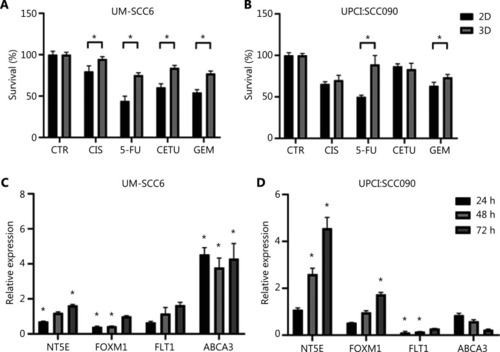
3D cultured cells acquire drug-resistance mechanisms. (A, B) Cytotoxicity analysis of UM-SCC6 and UPCI:SCC090 cell lines treated with cisplatin, 5-fluorouracil, cetuximab, and gemcitabine. Differences between 2D and 3D cultures were assessed by a 2-tailed Student’s t-test and accepted as significant (*) at P < 0.05. (C, D) NT5E, FOXM1, FLT1, and ABCA3 gene expression analysis in 3D vs. 2D cultures after 24, 48, and 72 h. Data represent mean ± standard deviation. *P < 0.05, 2-tailed Student’s t-test. 3D, 3-dimensional; CIS, cisplatin; 5-FU, 5-fluorouracil; CETU, cetuximab; GEM, gemcitabine; 2D, 2-dimensional.

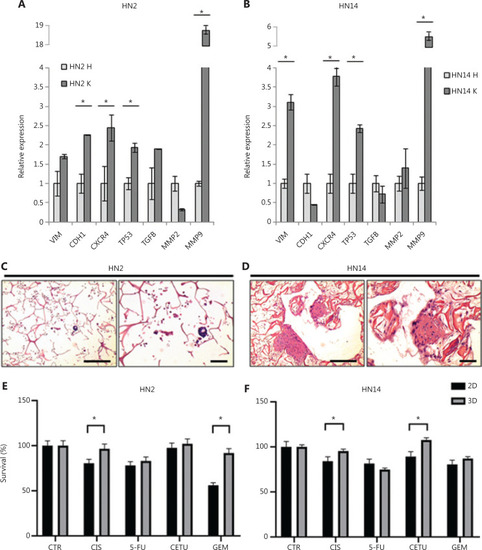
Drug-resistance mechanisms are also conserved in HNC patient-derived primary cultures. (A, B) VIM, CDH1, CXCR4, TP53, TGFβ, MMP2, and MMP9 gene expression analysis in patient tumor tissue (HN2 K and HN14 K) vs. healthy tissue (HN2 H and HN14 H). Data represent mean ± standard deviation. *P < 0.05, 2-tailed Student’s t-test. (C, D) Images of H&E-stained histological sections of HN2 and HN14 3D primary cultures. From left: H&E images at 10× magnification (scale bars: 100 µm) and 20× magnification (scale bars: 50 µm). (E, F) Cytotoxic analysis of HN2 and HN14 primary cultures. 2D and 3D cultures were treated with CIS, 5-FU, CETU, and GEM. Differences between 2D and 3D cultures were assessed by a 2-tailed Student’s t-test and accepted as significant (*) at P < 0.05. HNC, head and neck carcinoma; H&E, hematoxylin and eosin; 3D, 3-dimensional; 2D, 2-dimensional; CIS, cisplatin; 5-FU, 5-fluorouracil; CETU, cetuximab; GEM, gemcitabine.

Acknowledgments
This image is the copyrighted work of the attributed author or publisher, and ZFIN has permission only to display this image to its users. Additional permissions should be obtained from the applicable author or publisher of the image. Full text @ Cancer Biol Med