
|
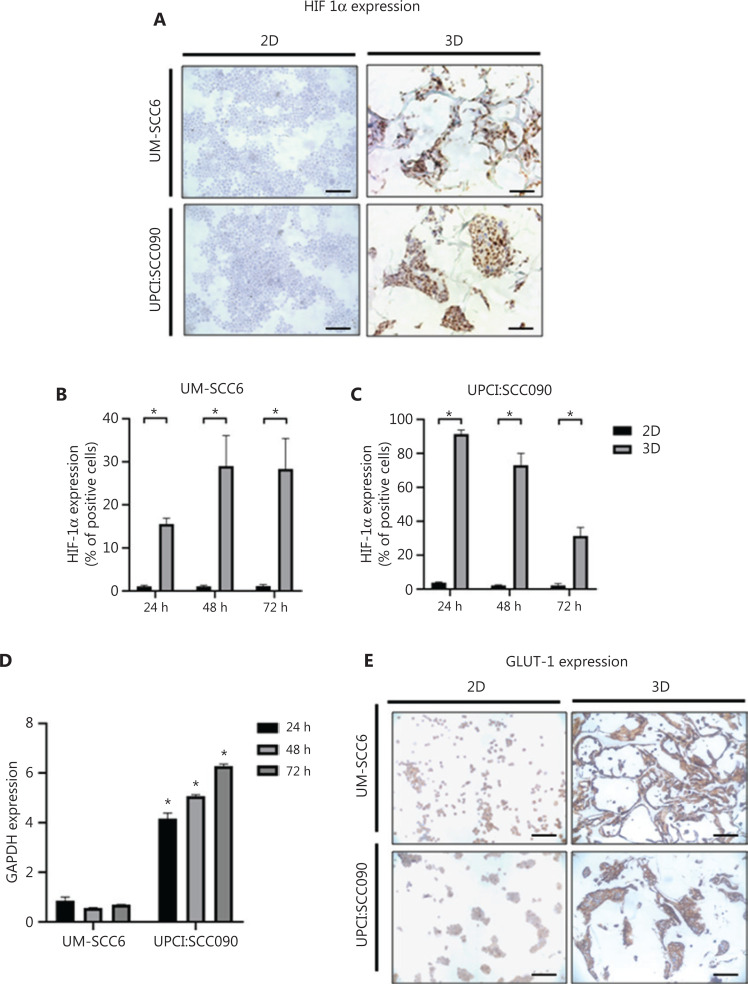
Figure 3
3D microenvironment induces hypoxic and glycolytic adaptation by oropharyngeal squamous cell carcinoma cells. (A) Representative images of HIF-1α-stained cytospinned cells and histological sections of 2D and 3D cultures (scale bar: 50 µm). (B, C) Percentage of HIF-1α-positive cells in 2D and 3D cultures of UM-SCC6 and UPCI:SCC090 after 24, 48, and 72 h. Data represent mean ± standard deviation. *