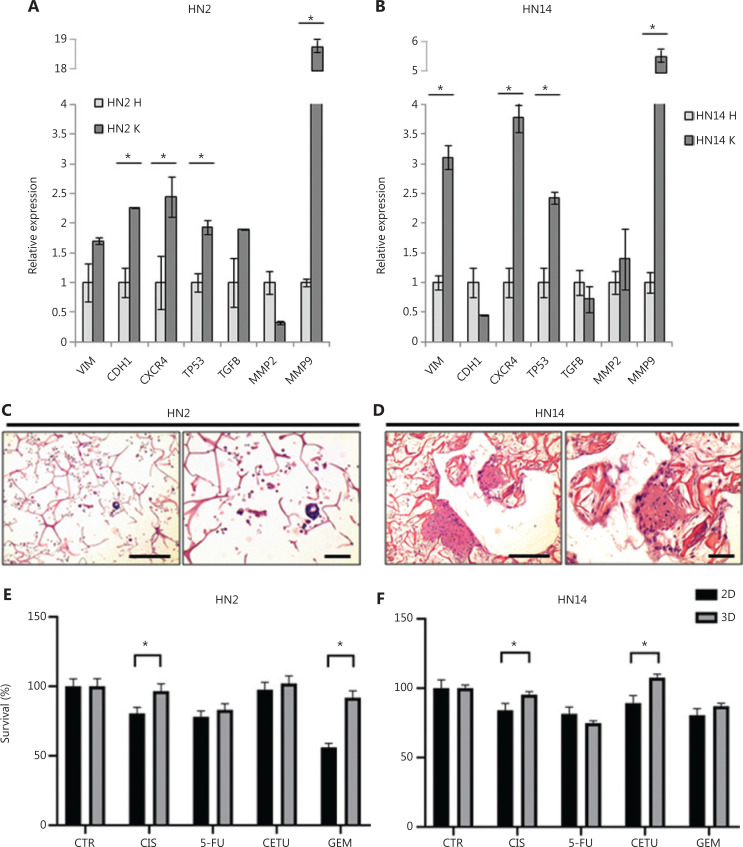
Drug-resistance mechanisms are also conserved in HNC patient-derived primary cultures. (A, B) VIM, CDH1, CXCR4, TP53, TGFβ, MMP2, and MMP9 gene expression analysis in patient tumor tissue (HN2 K and HN14 K) vs. healthy tissue (HN2 H and HN14 H). Data represent mean ± standard deviation. *P < 0.05, 2-tailed Student’s t-test. (C, D) Images of H&E-stained histological sections of HN2 and HN14 3D primary cultures. From left: H&E images at 10× magnification (scale bars: 100 µm) and 20× magnification (scale bars: 50 µm). (E, F) Cytotoxic analysis of HN2 and HN14 primary cultures. 2D and 3D cultures were treated with CIS, 5-FU, CETU, and GEM. Differences between 2D and 3D cultures were assessed by a 2-tailed Student’s t-test and accepted as significant (*) at P < 0.05. HNC, head and neck carcinoma; H&E, hematoxylin and eosin; 3D, 3-dimensional; 2D, 2-dimensional; CIS, cisplatin; 5-FU, 5-fluorouracil; CETU, cetuximab; GEM, gemcitabine.
Acknowledgments
This image is the copyrighted work of the attributed author or publisher, and
ZFIN has permission only to display this image to its users.
Additional permissions should be obtained from the applicable author or publisher of the image.
Full text @ Cancer Biol Med
Your Input Welcome
Thank you for submitting comments. Your input has been emailed to ZFIN curators who may contact you if
additional information is required.
Oops. Something went wrong. Please try again later.