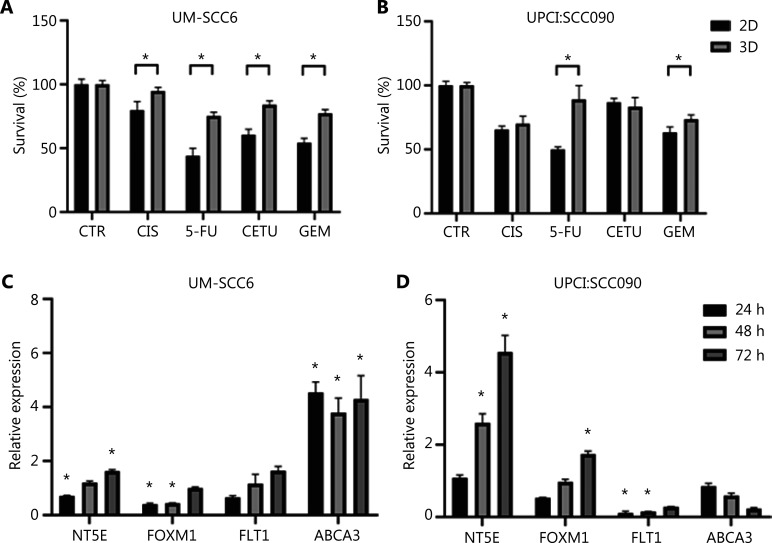
IMAGE

Figure 4

ID
ZDB-IMAGE-210628-8
Source
Figures for Miserocchi et al., 2021
Image
Figure Caption

Figure 4

3D cultured cells acquire drug-resistance mechanisms. (A, B) Cytotoxicity analysis of UM-SCC6 and UPCI:SCC090 cell lines treated with cisplatin, 5-fluorouracil, cetuximab, and gemcitabine. Differences between 2D and 3D cultures were assessed by a 2-tailed Student’s t-test and accepted as significant (*) at P < 0.05. (C, D) NT5E, FOXM1, FLT1, and ABCA3 gene expression analysis in 3D vs. 2D cultures after 24, 48, and 72 h. Data represent mean ± standard deviation. *P < 0.05, 2-tailed Student’s t-test. 3D, 3-dimensional; CIS, cisplatin; 5-FU, 5-fluorouracil; CETU, cetuximab; GEM, gemcitabine; 2D, 2-dimensional.

Acknowledgments
This image is the copyrighted work of the attributed author or publisher, and ZFIN has permission only to display this image to its users. Additional permissions should be obtained from the applicable author or publisher of the image. Full text @ Cancer Biol Med