IMAGE

Figure 2

ID
ZDB-IMAGE-210628-6
Source
Figures for Miserocchi et al., 2021
Image
Figure Caption

Figure 2

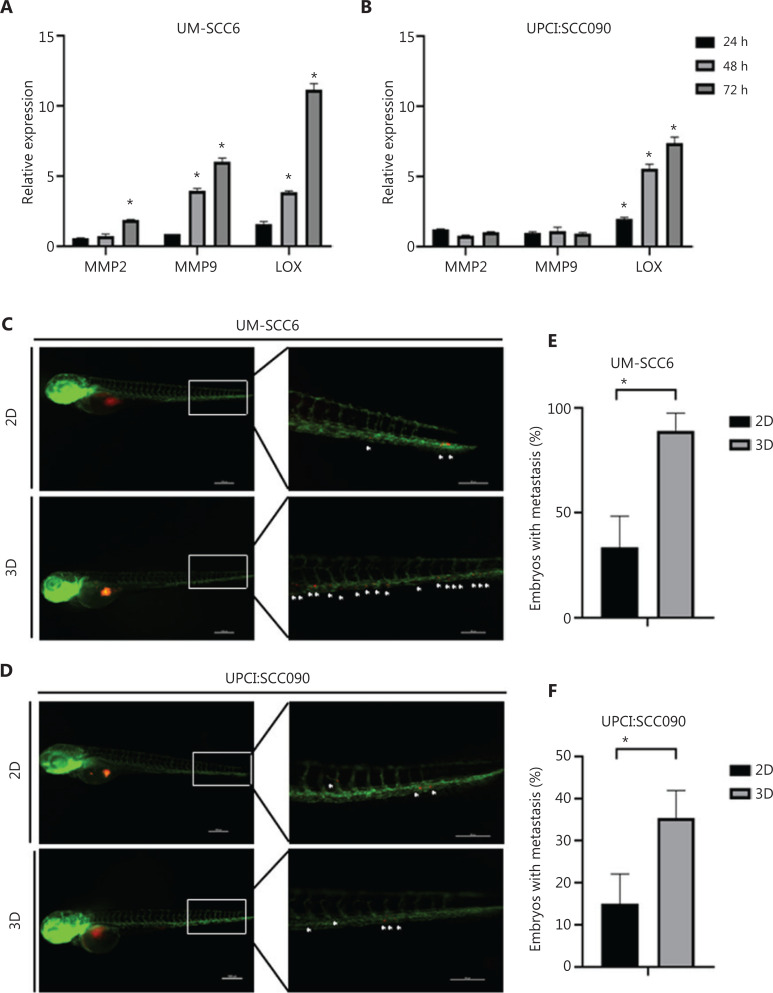
Cells cultured in the scaffold interact with collagen fiber network and display higher cell migration inside the vessels of zebrafish embryos. (A, B) UM-SCC6 and UPCI:SCC090 relative expression levels of MMP2, MMP9, and LOX in 3D vs. 2D cultures after 24 h, 48 h, and 72 h. Data represent mean ± standard deviation. *P < 0.05, 2-tailed Student’s t-test. (C, D) Representative pictures of Tg(fli1:EGFP) embryos injected with UM-SCC6 and UPCI:SCC090 recovered from 2D and 3D cultures and labeled with a red fluorescent dye (CM-Dil). The images show the whole embryo body and tail region details at 24 hpi. The white asterisks show single or small cell clusters. (E, F) Percentage of embryos showing distant micrometastases. Data represent mean ± standard error. *P < 0.05, 2-tailed Student’s t-test. 3D, 3-dimensional; 2D, 2-dimensional.

Acknowledgments
This image is the copyrighted work of the attributed author or publisher, and ZFIN has permission only to display this image to its users. Additional permissions should be obtained from the applicable author or publisher of the image. Full text @ Cancer Biol Med