IMAGE

Figure 1

ID
ZDB-IMAGE-210628-5
Source
Figures for Miserocchi et al., 2021
Image
Figure Caption

Figure 1

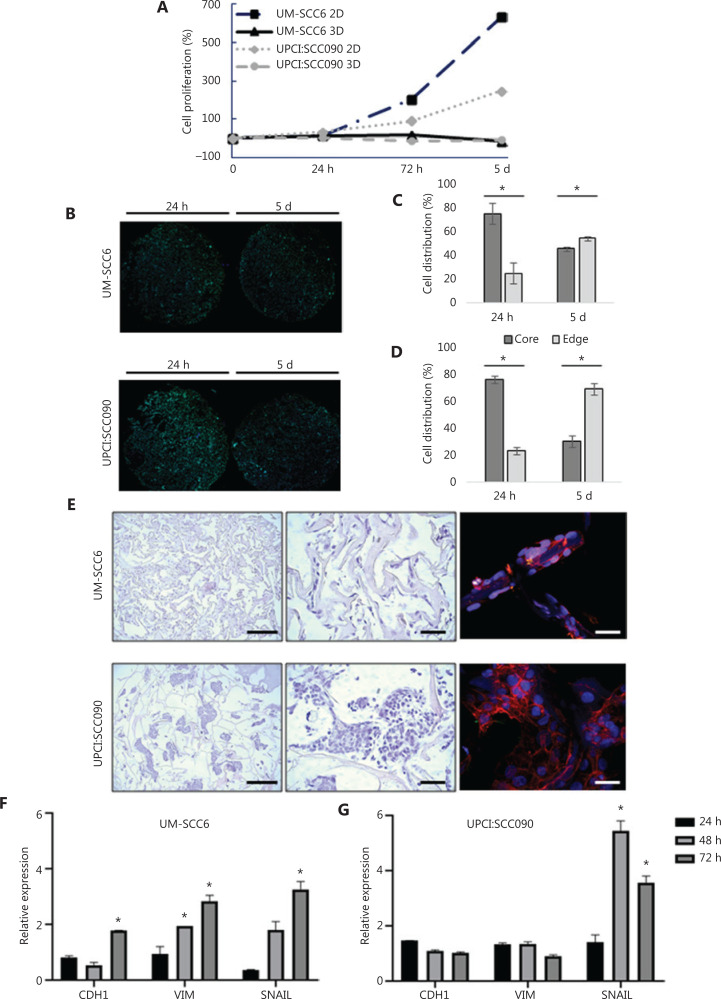
Characterization of the 3D oropharyngeal squamous cell carcinoma culture model. (A) Fold changes in percentage of cell proliferation (relative to hour 0) of UM-SCC6 and UPCI:SCC090 in monolayer (2D) and in scaffolds (3D) after 24 h, 72 h, and 5 days. (B) Whole images of histological sections of scaffold cultured with UM-SCC6 and UPCI:SCC090 on days 1 and 5. Cells are stained with DAPI (blue) and green is the collagen scaffold autofluorescence. Scale bars: 1 mm. (C, D) Cell percentage in the core and at the edge of the scaffold area. Data represent mean ± standard deviation. *P < 0.05, 2-tailed Student’s t-test. (E) Images of H&E-stained histological sections and confocal images of UM-SCC6 and UPCI:SCC090 scaffold cultures. From above: H&E images at 4× magnification (scale bars: 100 µm) and 20× magnification (scale bars: 50 µm); confocal images of sections stained with phalloidin in red and DAPI in blue (scale bar: 20 µm). (F, G) CDH1, VIM, and SNAIL relative mRNA expression in UM-SCC6 and UPCI:SCC090 within the scaffold vs. 2D cultures after 24, 48, and 72 h. Data represent mean ± standard deviation. *P < 0.05, 2-tailed Student’s t-test. 3D, 3-dimensional; 2D, 2-dimensional; H&E, hematoxylin and eosin; DAPI, 4′,6-diamidino-2-phenylindole.

Acknowledgments
This image is the copyrighted work of the attributed author or publisher, and ZFIN has permission only to display this image to its users. Additional permissions should be obtained from the applicable author or publisher of the image. Full text @ Cancer Biol Med