FIGURE SUMMARY
Title

ITPR1 Mutation Contributes to Hemifacial Microsomia Spectrum

Authors
Liu, Z., Sun, H., Dai, J., Xue, X., Sun, J., Wang, X.
Source
Full text @ Front Genet

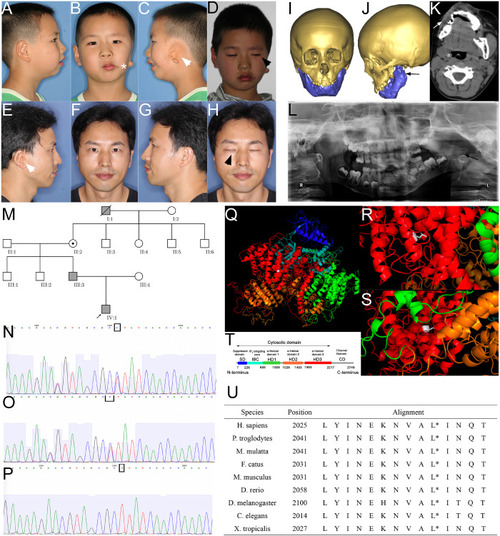
Phenotype and pedigrees of the proband with ITPR1 mutation. (A–H) Photos of the proband and his father, note the facial asymmetry, microtia (white arrowhead), dysfunction of the zygomatic branch of the facial nerve (black arrowhead), proband also suffered from macrostomia (star). (I–L) Facial CT scans with bone reconstruction and panoramic film of the proband showed hypoplasia of the left mandible ramus (black arrow) and the soft tissues (white arrow). (M) Pedigrees of the family, the proband, proband’s father, the proband’s great grandfather diagnosed with HM. (N–P) Sanger sequencing verified the mutation in the proband (N), his father (O), and proband’s mother. (Q–T) Molecular modeling by PDB’s information, blue indicates the suppressor domain, cyan represented IP3 binding core, green, orange, and red represented α-helical domain 1, 2, and 3, respectively. White indicates the point of a missense mutation, (R) leucine of the wild-type, which is a short-chain amino acid, (S) to proline (mutant), which has a benzene ring. (T) Domain illustration of ITPR1. (U) Alignment of amino acids, spanning 14 residues in diverse species, showing that this position is highly conserved (highlighted with red circle).

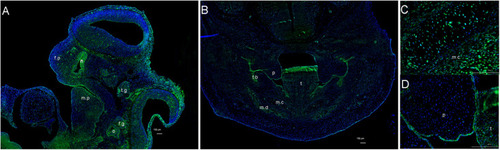
Expression pattern of
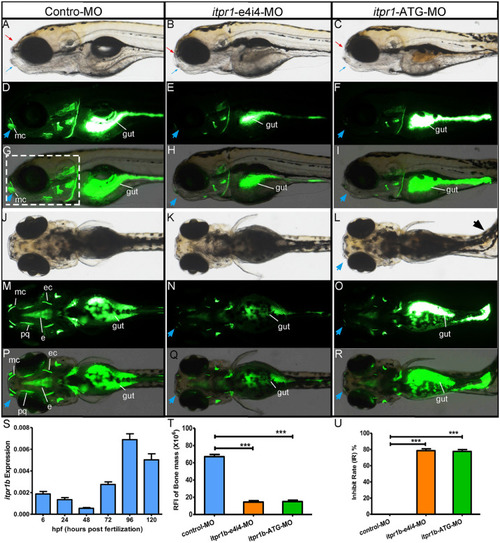
 ITPR1. (A) At E 11.5, ITPR1 is expressed in the frontonasal process, first branchial arch, and second branchial arch, like the mandibular process, nasal pit, otocyst, trigeminal (V) ganglia, and facial-acoustic (VII-VIII) ganglia. (B) By E13.5, ITPR1 shows significant expression at the craniofacial region, like the tooth bud, mandibular mesenchyme, (C) epithelial layer of palate shelves, and (D) Meckel’s cartilage. ITPR1 is marked in green fluorescence. DNA was stained by DAPI and is marked in blue fluorescence. Abbreviations are as follows: f.p, frontonasal process; f.n, nasal pit; m.p, mandibular process; o, otocyst; t.g, trigeminal (V) ganglia; f.g, facioacoustic (VII-VIII) ganglia; p, palate, t, tongue; t.b, tooth bud; m.c, Meckel’s cartilage; m.d, mandible.

Gross morphology of zebrafish with itpr1b knocked down at 5-dpf. Lateral view of control MO-injected zebrafish embryos and embryos injected with itpr1b morpholino oligonucleotides (MO) (A–I). Calcium staining by calcein in MO-control, MO-itpr1-e4i4, and MO-itpr1-ATG morphants at 120 hpf (hours post-fertilization). Both MO-itpr1-e4i4, MO-itpr1-ATG morphants showed bimaxillary retrognathia [(A–C), red arrowed indicated the upper jaw, blue arrowed indicated the lower jaw]. The gut is filled with calcein (D–I,M–R). Fluorescent signals were apparent in 120-hpf embryos and restricted to the head skeleton (D–I,M–R). For MO-itpr1-e4i4 and MO-itpr1-e4i4 morphants, Meckel’s cartilage can barely be recognized [blue arrowhead, (E,F,H,I)]. From the ventral view (J–R), scoliosis can be observed in MO-itpr1-ATG (black arrowhead), Meckel’s cartilage is undistinguished (blue arrowhead). Fluorescent signals were greatly reduced in palatoquadrate and ethmoid and ectopterygoid. (S)itpr1b expression was induced in 72-hpf embryos, further increased at 96 hpf, and remained elevated at 120 hpf. (T) Graph presenting the quantification of the relative fluorescence intensity (RFI) of head skeleton bone mass (N = 10, ANOVA, ***P < 0.001). (U) Graph presenting the quantification of the inhibit rate (IR) of head skeleton bone mass (N = 10, ANOVA, ***P < 0.001). The region used to calculate bone mass is shown in panel (G) highlighted with the dashed rectangle. mc, Meckel’s cartilage; pq, palatoquadrate; ec, ectopterygoid; e, ethmoid.

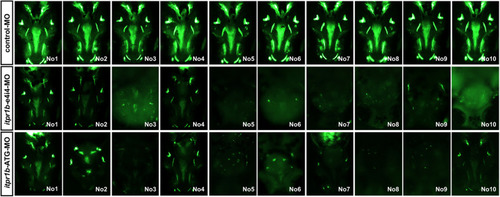
Zebrafish have been picked up to take photos and calculate the craniofacial skeleton mass.

PHENOTYPE:
Fish:
Knockdown Reagents:
Observed In:
Stage: Day 5

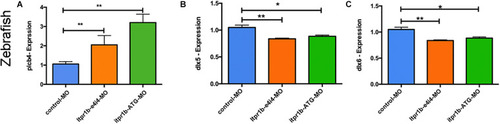
ITPR1 involved in the EDN-PLC-DLX5/6 axis. (A) qRT-PCR analysis of plcb4 expression in zebrafish with itpr1b knockdown was shown, plcb4 transcripts increased in both MO-itpr1-e4i4 and MO-itpr1-ATG morphants. The relative transcript level was calculated as fold change using the 2– ΔΔCt method (ANOVA) (N = 5). (B,C) dlx5 and dlx6 transcripts decreased in both MO-itpr1-e4i4 and MO-itpr1-ATG morphants. (ANOVA, N = 5).

EXPRESSION / LABELING:
Genes:
Fish:
Knockdown Reagents:
Anatomical Term:
Stage: Day 5
PHENOTYPE:
Fish:
Knockdown Reagents:
Observed In:
Stage: Day 5

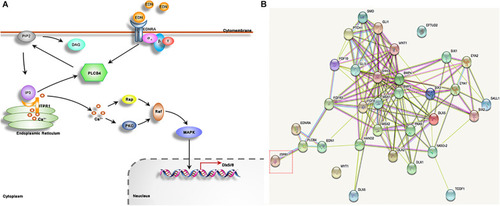
ITPR1 is involved in different pathways. (A) It has been illustrated by several reports that the EDN-EDNRA-G protein αq-DLX5/6 axis has important roles in mandible formation. EDN binds to receptor EDNRA, a G-protein that can activate PLCB4. PLCB4 splits PIP2, membrane-bound phospholipids, into DAG and IP3. IP3 binds to its receptor ITPR1, a calcium release channel, to allow the passage of calcium to move through. Calcium works to activate PKC and Rap, and stimulate MAPK signaling, which can regulate Dlx5 and Dlx6 expression. (B) The network of protein-protein interaction is shown, produced by STRING software (https://string-db.org), including ITPR1 and its closest partner PLCB4. EDN1 and EDNRA genes may be involved in craniofacial development especially those reported as a causative protein of human mandibular deformities, and among those with gene mutation have been reported in HM patients, like MYT1 and EFTUD2.

Acknowledgments
This image is the copyrighted work of the attributed author or publisher, and ZFIN has permission only to display this image to its users. Additional permissions should be obtained from the applicable author or publisher of the image. Full text @ Front Genet