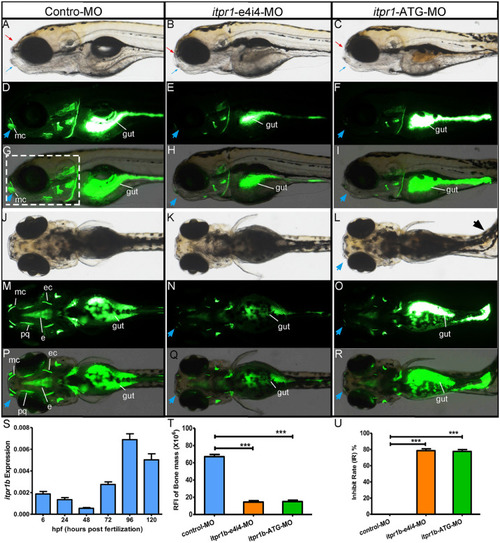
Gross morphology of zebrafish with itpr1b knocked down at 5-dpf. Lateral view of control MO-injected zebrafish embryos and embryos injected with itpr1b morpholino oligonucleotides (MO) (A–I). Calcium staining by calcein in MO-control, MO-itpr1-e4i4, and MO-itpr1-ATG morphants at 120 hpf (hours post-fertilization). Both MO-itpr1-e4i4, MO-itpr1-ATG morphants showed bimaxillary retrognathia [(A–C), red arrowed indicated the upper jaw, blue arrowed indicated the lower jaw]. The gut is filled with calcein (D–I,M–R). Fluorescent signals were apparent in 120-hpf embryos and restricted to the head skeleton (D–I,M–R). For MO-itpr1-e4i4 and MO-itpr1-e4i4 morphants, Meckel’s cartilage can barely be recognized [blue arrowhead, (E,F,H,I)]. From the ventral view (J–R), scoliosis can be observed in MO-itpr1-ATG (black arrowhead), Meckel’s cartilage is undistinguished (blue arrowhead). Fluorescent signals were greatly reduced in palatoquadrate and ethmoid and ectopterygoid. (S)itpr1b expression was induced in 72-hpf embryos, further increased at 96 hpf, and remained elevated at 120 hpf. (T) Graph presenting the quantification of the relative fluorescence intensity (RFI) of head skeleton bone mass (N = 10, ANOVA, ***P < 0.001). (U) Graph presenting the quantification of the inhibit rate (IR) of head skeleton bone mass (N = 10, ANOVA, ***P < 0.001). The region used to calculate bone mass is shown in panel (G) highlighted with the dashed rectangle. mc, Meckel’s cartilage; pq, palatoquadrate; ec, ectopterygoid; e, ethmoid.
|
