
FIGURE
FIGURE 5
- ID
- ZDB-FIG-210324-13
- Publication
- Liu et al., 2021 - ITPR1 Mutation Contributes to Hemifacial Microsomia Spectrum
- Other Figures
- All Figure Page
- Back to All Figure Page
FIGURE 5
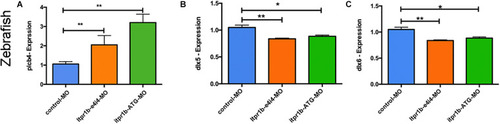
ITPR1 involved in the EDN-PLC-DLX5/6 axis. (A) qRT-PCR analysis of plcb4 expression in zebrafish with itpr1b knockdown was shown, plcb4 transcripts increased in both MO-itpr1-e4i4 and MO-itpr1-ATG morphants. The relative transcript level was calculated as fold change using the 2– ΔΔCt method (ANOVA) (N = 5). (B,C) dlx5 and dlx6 transcripts decreased in both MO-itpr1-e4i4 and MO-itpr1-ATG morphants. (ANOVA, N = 5). |
Expression Data
| Genes: | |
|---|---|
| Fish: | |
| Knockdown Reagents: | |
| Anatomical Term: | |
| Stage: | Day 5 |
Expression Detail
Antibody Labeling
Phenotype Data
| Fish: | |
|---|---|
| Knockdown Reagents: | |
| Observed In: | |
| Stage: | Day 5 |
Phenotype Detail
Acknowledgments
This image is the copyrighted work of the attributed author or publisher, and
ZFIN has permission only to display this image to its users.
Additional permissions should be obtained from the applicable author or publisher of the image.
Full text @ Front Genet