
- Title
-
Methyl gallate, gallic acid-derived compound, inhibit cell proliferation through increasing ROS production and apoptosis in hepatocellular carcinoma cells
- Authors
- Huang, C.Y., Chang, Y.J., Wei, P.L., Hung, C.S., Wang, W.
- Source
- Full text @ PLoS One
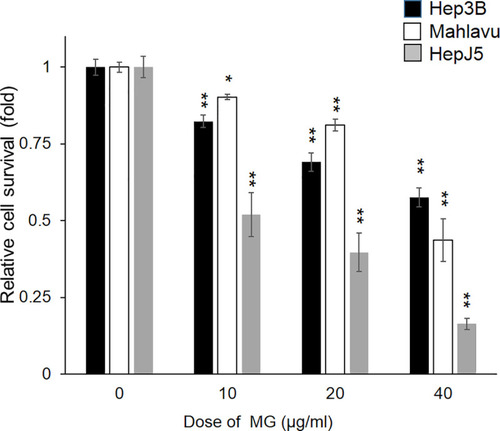
After treating Hep3B, Mahlavu, and HepJ5 cells with different doses of MG (0~40 μg/ml) for 48h, the relative cell survival rate was determined using an SRB assay. Survival of vehicle-treated cells was defined as 100%. MG treatment showed reduction of the cell survival rate in HCC cells in a dose-dependent manner. Data are expressed as the mean±SD of three independent experiments in triplicate (* p<0.05, ** |
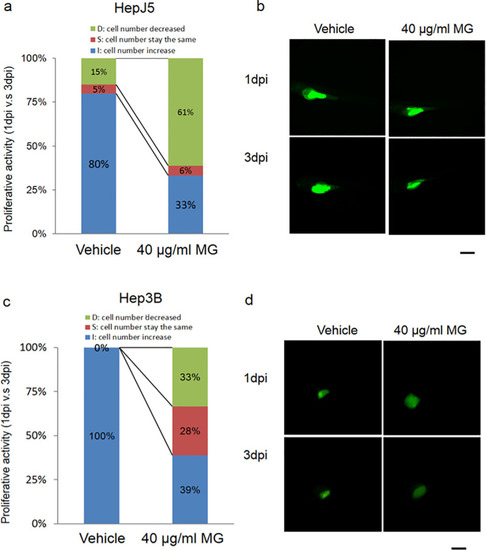
Zebrafish was used as the animal model for the xenotransplantation assay to determine the efficacy of MG treatment in hepatocellular carcinoma (HCC). Fluorescence labeled Hep3B and HepJ5 cells were implanted into an embryo yolk of the zebrafish, and then embryos were exposed to 40 μg/ml MG or dH2O as a vehicle control. Proliferative activities of the HCC cell lines in the embryos (n = 20 for each group) were compared by monitoring the fluorescence intensity on days 1 and 3 post-injection (1 and 3 dpi) of MG. (a and b) MG treatment reduced the increase in cell numbers in the embryo population (from 80% for the vehicle to 33% embryos respectively) in HepJ5 cells. A decrease in the fluorescence intensity was shown after 3 days in Hep3B cells with 40 μg/ml MG treatment (c and d). In the Hep3B cell line, the increase in cell numbers in the embryo population decreased from 100% (vehicle) to 39% (40 μg/ml) within 20 embryos. Treatment with 40 μg/ml MG dramatically decreased the fluorescence intensity in HCC cells compared to the vehicle. Scale bare was 1 mm. PHENOTYPE:
|
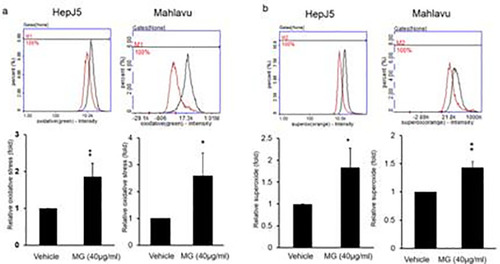
Both of HepJ5 and Mahlavu cells were treated with 40 μg/ml MG for 24 h. ROS and superoxide levels were detected using specific dyes. MG treatment significantly increased ROS and superoxide levels compared to the vehicle. Data are presented as the mean±SD of three independent experiments in triplicate (* |
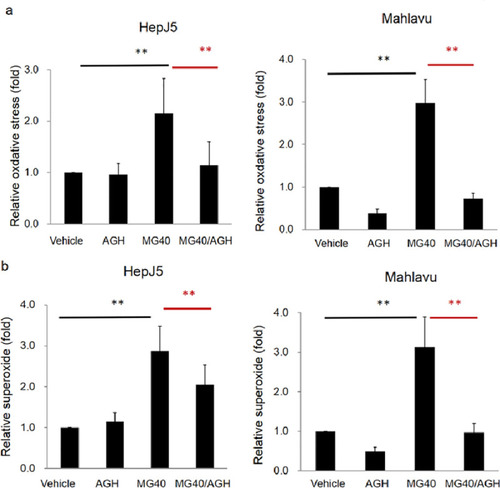
HepJ5 and Mahlavu cells were treated with AGH and then exposed to MG. Levels of ROS and superoxide were detected using specific fluorescence dyes. (a) Significant increase of the ROS level was found after MG treatment. The MG-induced ROS level was abolished in AGH pretreated HepJ5 and Mahlavu cells. (b) The superoxide level increased after exposure to MG and was abolished with AGH pretreatment. Data are presented as the mean±SD of three independent experiments in triplicate (** p<0.01). |
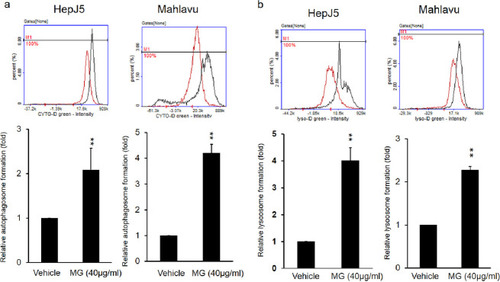
HepJ5 and Mahlavu cells were exposed to 40 μg/ml MG for 24 h. (a) Autophagosomes and (b) lysosomes were detected using specific dyes. The formation of autophagosomes and lysosomes increased after MG treatment compared to the vehicle. Data are presented as the mean±SD of three independent experiments in triplicate (** p<0.01). |
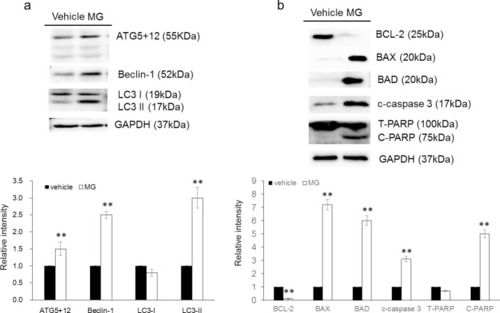
HepJ5 cells were treated with 40 μg/ml MG or vehicle for 48h. |
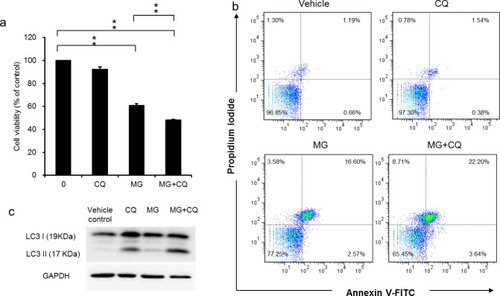
The cell viability in cells treated with MG for 24 h in the presence and absence of CQ for 16 h was determined using SRB assay (a). Apoptotic cells were quantified using Annexin V-FITC/PI staining and FACS analysis after 40 μg/ml MG treatment for 48h in the presence and absence of CQ for 16 h (b). The blockage of autophagy flux was confirmed by detecting the accumulation of LC3-II using western blot (c). Data are presented as the mean±SD of three independent experiments in triplicate, ** p<0.01). |