
- Title
-
TAp73β Can Promote Hepatocellular Carcinoma Dedifferentiation
- Authors
- Iscan, E., Ekin, U., Yildiz, G., Oz, O., Keles, U., Suner, A., Cakan-Akdogan, G., Ozhan, G., Nekulova, M., Vojtesek, B., Uzuner, H., Karakülah, G., Alotaibi, H., Ozturk, M.
- Source
- Full text @ Cancers
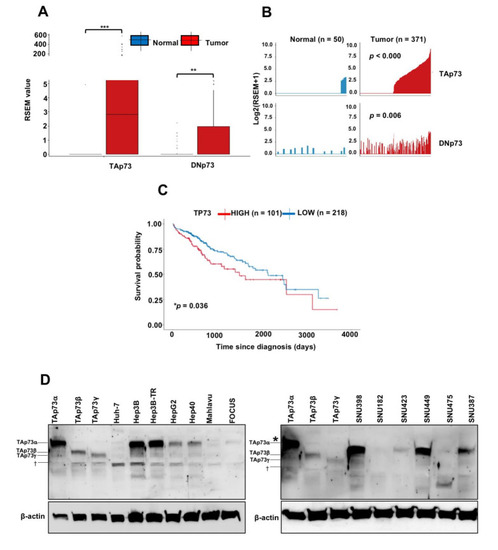
Strongly induced expression of TAp73 isoforms in hepatocellular carcinoma and poor survival of patients with a high p73 expression. (A) Box plots of p73 isoforms (TAp73 versus DNp73 isoforms) expression in non-tumor liver (normal; n = 50) and hepatocellular carcinoma (tumor; n = 371) were collected from the TSVdb database. *** p < 0.001 and ** p = 0.006 for significant differences between normal and tumor samples. (B) Bar plots of TAp73 and DNp73 isoforms distribution in normal and tumor samples. TAp73: Tumor %53.1 (n = 197/371)—Normal %8.0 (n = 4/50); DNp73: Tumor %37.4 (n = 139/371)—Normal %24.0 (n = 12/50) (C) Survival curves of liver cancer patients as a p73 high expression (n = 101), versus p73 low expression (n = 218). * p < 0.05. (D) p73 isoform expression in HCC cell lines was examined by western blot using a primary antibody against the full-length p73, which detects both TAp73 and DNp73 isoforms [27] and β-actin was used as a loading control (n = 2). p73 isoforms endogenously expressed in HCC cell lines were identified by comparing their relative migrations in the SDS-PAGE system in comparison with ectopically expressed TAp73α, TAp73β and TAp73γ isoforms in Huh-7 cells using mammalian expression vectors. † Non-specific signals. * The apperant shift observed here is due to a problem of gel migration. |
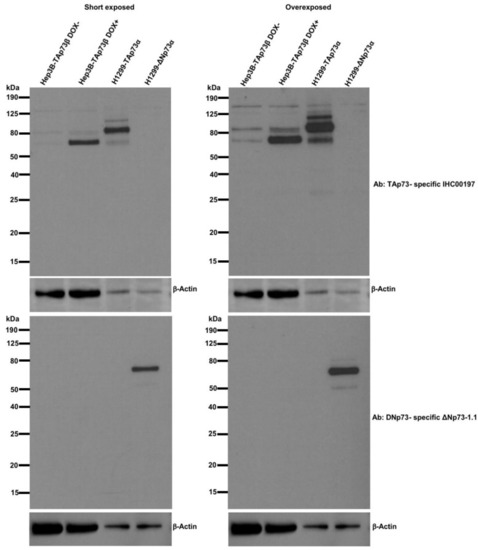
T-Rex-inducible expression in Hep3B cells resulted in TAp73β overexpression, with no detectable expression of DNp73 protein. Hep3B cells with (Hep3BTAp73β DOX+) or without (Hep3BTAp73β DOX−) doxycycline treatment were compared to H1299 transiently transfected with TAp73α (H1299-TAp73α) or DNp73 (H1299-DNp73). Western blot analysis of cell lysates using IHC00197 antibody recognizing TAp73 isoforms (top panel) and western blot analysis of cell lysates using ΔNp73-1.1 antibody recognizing DNp73 isoforms [31,32] (bottom panel). β-actin antibody was using as a loading control. |
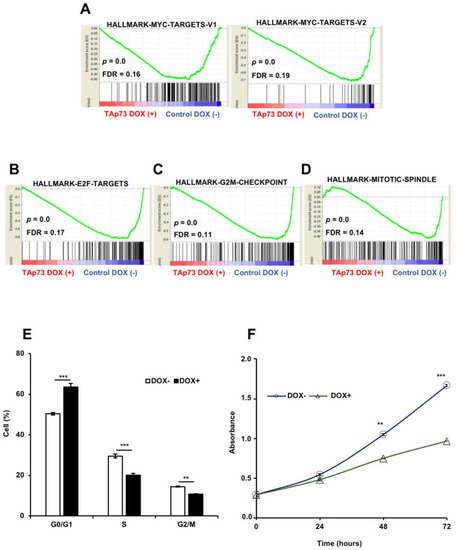
TAp73β down-regulates cell proliferation by increasing the proportion of cells at G0/G1 phase at the expense of S and G2/M phase cells. Gene set enrichment analyses showing the repression of (A) Myc-target genes, (B) E2F target genes, (C) genes involved in G2/M cell cycle progression, and (D) mitotic spindle associated genes. (E) TAp73β causes moderate inhibition of cell cyle progression by increasing the relative number of cells at G0/G1 phase. Hep3BTAp73β cells were treated with doxycycline (1 µg/mL) for 72 h, and cell cycle distribution was evaluated by using flow cytometric DNA content analysis. (F) TAp73β decreases cell proliferation by 40%, but does not stop cell growth. Hep3BTAp73β cells were exposed to doxycycline (1 µg/mL) for 0 h, 24 h, 48 h and 72 h. At the end of the indicated times, cell proliferation was measured by the SRB method. Columns and error bars indicate ± SD from triplicate experiments. ** p < 0.001 and *** p < 0.0001 for significant differences between cells treated and not treated with doxycycline. |
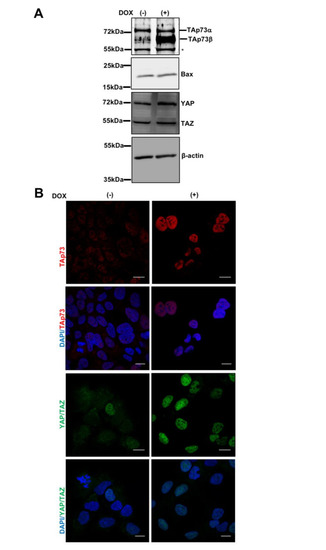
TAp73β activates expression and nuclear localization of YAP, but does not affect Bax expression. (A) Hep3BTAp73β cells were treated with doxycycline (1 µg/mL) for 72 h and cell lysates were obtained, then western blot was performed for p73, YAP and Bax expression. β-actin was used as a loading control (n = 2). * Non-specific signals. (B) Upon TAp73β induction, both TAp73 and YAP show nuclear accumulation (*). Immunofluorescence assay was performed to determine the expression and localization of p73 (Red), YAP (Green), respectively in Hep3BTAp73β cells treated with Doxycycline (1 µg/mL) for 72 h. DAPI (blue) was used for nuclear counterstain. Images were taken at x63 magnification in a confocal microscope. Scale bar = 20 μm. * Please note that the antibody used for TAp73β immunofluorescence recognizes all p73 isoforms [27]. Similarly, D24E4 antibody used for YAP immunofluorescence also detects TAZ protein. |
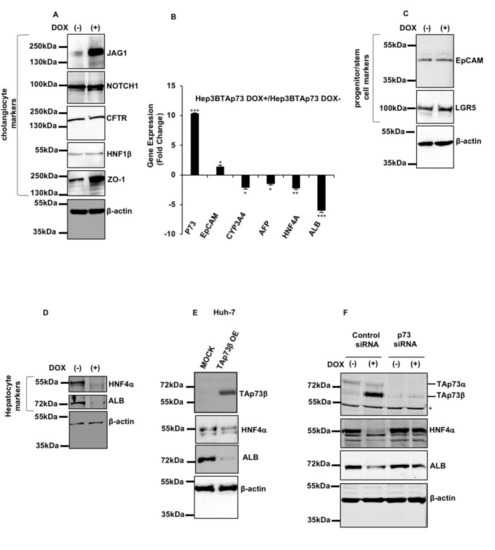
TAp73β induced the expression of cholangiocyte promoting genes (JAG1, NOTCH1, ZO-1) while repressing hepatocyte fate markers (CYP3A4, AFP, HNF4α, ALB) without affecting progenitor/stem marker (EpCAM, LGR5) expression. Hep3BTAp73β cells were treated with Doxycycline (1 µg/mL) to induce TAp73β expression for 72 h and cell lysates and RNA were obtained, then western blot and RT-PCR were performed. (A) Western blotting of cholangiocyte markers JAG1, NOTCH1, CFTR, HNF1β, ZO-1 (n = 2). (B) EpCAM progenitor/stem cell marker and hepatocyte markers, CYP3A4, AFP, HNF4α and ALB expressions were examined by RT-PCR. GAPDH was used as a housekeeping gene. Column graphs show the fold change and calculated by using the 2−∆∆Ct method. * p < 0.05, ** p < 0.001 and *** p < 0.0001. (C) Western blotting of progenitor/stem markers EpCAM, and LGR5 (n = 2). (D) Western blotting of hepatocyte markers ALB and HNF4α (n = 2). (E) Huh7 cells were transiently transfected with TAp73β and, HNF4α and ALB protein levels were studied by western blotting. (F) Doxycyline-treated and untreated Hep3BTAp73β cells were transfected with p73siRNA and scrambled siRNA, respectively. Western blot analysis for p73, HNF4α and ALB expression in control siRNA and p73 siRNA transfected Hep3BTAp73β cells with or without doxycycline (1 µg/mL) induction (n = 2). * Non-specific signals. |
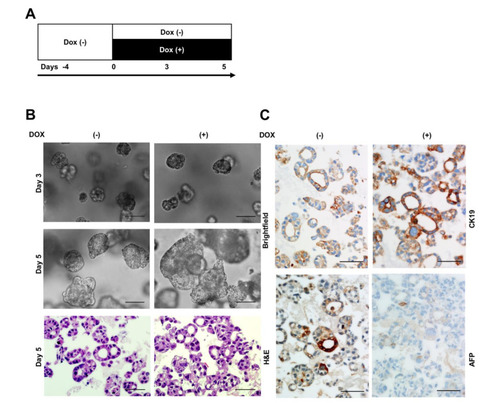
TAp73β represses AFP+ hepatocyte-like 3D cell structures formation while stimulating CK19+ cholangiocyte-like 3D cell structures formation. (A) A scheme depicting Hep3BTAp73β cells grown in the absence of doxycycline (DOX−) in Matrigel for 4 days, followed by additional growth in the absence (Dox−) or presence (DOX+) of doxycycline (1 µg/mL) for 5 days. (B) Brightfield images of differentially treated 3D cell structures at days 3 and 5, and H&E staining at day 5. (C) Immunohistochemistry staining for CK19 and AFP which was performed using formaldehyde-fixed paraffin-embedded 3D cell structures that have been grown 5 days in the presence (DOX+) or absence (DOX−) of doxycycline. Images were taken at ×20 magnification in a brightfield microscope. Scale bar = 100 μm. |
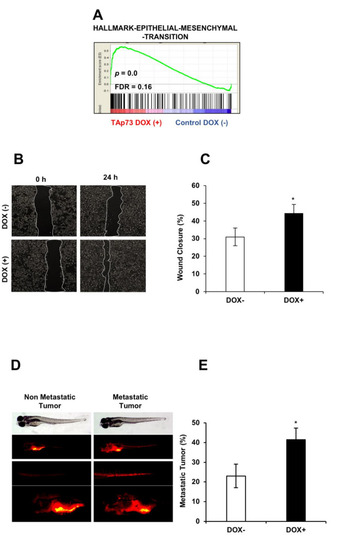
TAp73β upregulates epithelial-mesenchymal transition hallmark genes and stimulates metastatic abilities of hepatocellular carcinoma cells. ( PHENOTYPE:
|