
Figure 1
- ID
- ZDB-IMAGE-210310-3
- Publication
- Iscan et al., 2021 - TAp73β Can Promote Hepatocellular Carcinoma Dedifferentiation
- All Figures
- Figures for Iscan et al., 2021
|
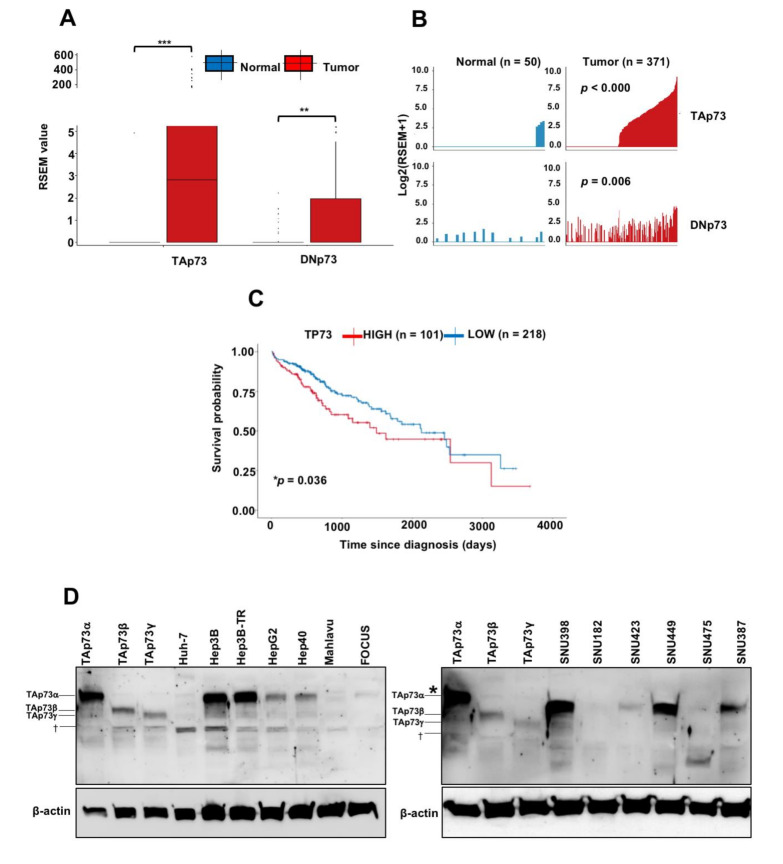
Figure 1 Strongly induced expression of TAp73 isoforms in hepatocellular carcinoma and poor survival of patients with a high p73 expression. (A) Box plots of p73 isoforms (TAp73 versus DNp73 isoforms) expression in non-tumor liver (normal; n = 50) and hepatocellular carcinoma (tumor; n = 371) were collected from the TSVdb database. *** p < 0.001 and ** p = 0.006 for significant differences between normal and tumor samples. (B) Bar plots of TAp73 and DNp73 isoforms distribution in normal and tumor samples. TAp73: Tumor %53.1 (n = 197/371)—Normal %8.0 (n = 4/50); DNp73: Tumor %37.4 (n = 139/371)—Normal %24.0 (n = 12/50) (C) Survival curves of liver cancer patients as a p73 high expression (n = 101), versus p73 low expression (n = 218). * p < 0.05. (D) p73 isoform expression in HCC cell lines was examined by western blot using a primary antibody against the full-length p73, which detects both TAp73 and DNp73 isoforms [27] and β-actin was used as a loading control (n = 2). p73 isoforms endogenously expressed in HCC cell lines were identified by comparing their relative migrations in the SDS-PAGE system in comparison with ectopically expressed TAp73α, TAp73β and TAp73γ isoforms in Huh-7 cells using mammalian expression vectors. † Non-specific signals. * The apperant shift observed here is due to a problem of gel migration.