FIGURE SUMMARY
Title

Adipose-derived mesenchymal stem cells promote the malignant phenotype of cervical cancer

Authors
Castro-Oropeza, R., Vazquez-Santillan, K., Díaz-Gastelum, C., Melendez-Zajgla, J., Zampedri, C., Ferat-Osorio, E., Rodríguez-González, A., Arriaga-Pizano, L., Maldonado, V.
Source
Full text @ Sci. Rep.

The coculture of HeLa/ADSC induces changes in the transcriptome of HeLa cells. (a) ADSCs were obtained from three donor patients. The table summarizes the main characteristics of the donor patients who underwent gastric bypass. (b) The purity of ADSCs in each patient was evaluated by flow cytometry analysis of cell surface markers including CD44, CD90, CD31 and CD45. The graph shows the percentage of positive and negative cells to each marker (n = 3 patients, 2 replicates, error bars = s.d.). (c) HeLa cells were cultured alone or in the presence of ADSCs by an indirect coculture system. The picture show that both cells lines are cultured in the same medium, but they are physically separated by a permeable membrane avoiding direct contact. (d) Bar chart shows the mRNAs altered in HeLa cells due to the presence of ADSCs. (e) The table shows the main molecular and cellular processes altered during coculture in HeLa. (f) The table shows the processes networks enriched during coculture in HeLa. (g) Schematic overview showing NF-kappa B as essential key hub driving gene expression, which was predicted to be activated in HeLa cells cocultured with ADSCs. (h) Top 20 differentially expressed genes in HeLa during coculture with ADSCs. (ij). Quantification of gene expression by ddPCR showing the validation of mRNAs altered in HeLa by the presence of ADSCs obtained from patients (j) or ATCC (k). Graphs represent three biological replicates, and the error bars are s.d., *p < 0.05).

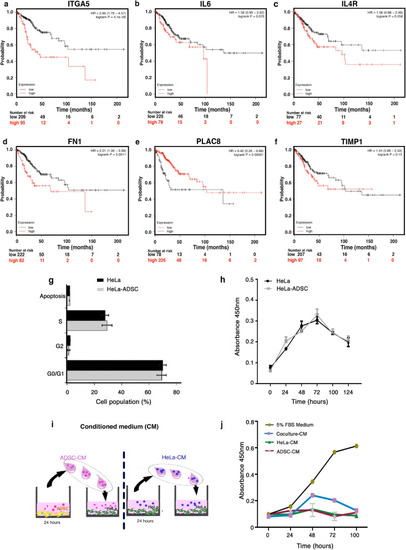
Deregulated genes altered by the presence of ADSC exhibit clinical significance in cervical cancer patients. (af) Kaplan Meyer curves comparing the overall survival of 304 cervical squamous cell carcinomas with low versus high expression of altered genes (ITGA5, IL6, IL4R, FN1, PLAC8, TIMP1). Data were obtained from a public database: KM Plotter. The “p” values are shown in each of the graphs. ADSCs do not alter the proliferative capacity of HeLa cells. (g) Cell cycle analysis of HeLa cells cocultured in the presence of ADSCs compared to HeLa control cells. (n = 3, the error bars are s.e.m) The graph shows no significant changes in any of the phases of the cell cycle. (h) Proliferation assay of HeLa control vs HeLa cells cocultured at different times. (i) The picture shows the method to obtain the conditioned medium of ADSCs (ADSC-CM) or the conditioned medium of HeLa cells (HeLa CM). ADSCs or HeLa cells were cultured in serum-free DMEM for 24 h and then the conditioned medium was employed to culture CC cells. (j) Proliferation assay of HeLa cells cultured with different conditioned media (CM) at different times. (n = 3, the error bars are S.D., but no significant changes were shown).

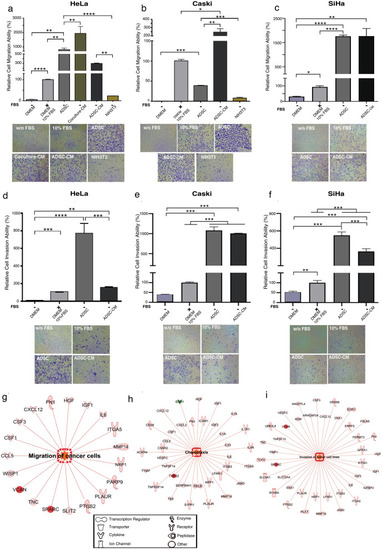
ADSCs influence the migration and invasion of cervical cancer cells. Graph shows the migration ability of HeLa (a), CaSki (b) and SiHa (c) cells cultured without serum and exposed to different chemoattractants including ADSCs, conditioned medium of coculture (Coculture-CM), conditioned medium of ADSCs (ADSC-CM) and NIH3T3 cells. As a control, CC cells were also cultured with DMEM supplemented with 10% FBS or without FBS. The graph shows the relative percentage of the migration capacity of HeLa, CaSki and SiHa cells after 12 h (a–c). The graph represents three biological replicates, error bars are s.d and *p < 0.05. Pictures show a representative image of the migratory CC cells in each condition. (d–f) Figures show the relative percentage of invading HeLa, CaSki and SiHa cells after 12 h of exposure to various chemoattractants. Figures show a representative image of invading cells in each condition. The graph represents three biological replicates, error bars are s.d and *p < 0.05. IPA analysis showing that the main altered transcripts in HeLa cells cultured in presence of ADSCs are involved in migration (g), chemotaxis (h), and invasion (i). The networks show differentially expressed genes regulated by each signaling pathway. The red color indicates the overexpression of the transcripts.

ADSC increases the CSC population, migration and invasion in an in vivo model. (a) Images show that the migration capacity of SiHa cells increases proportionally with respect to the amount of ADSCs inoculated in zebrafish embryos after 12 h. SiHa cells are shown in green due to they were transfected with a plasmid harboring a GFP gene. The images show a gradual increase in the migration and invasion of cancer cells from the yolk to the tail of embryos due to the presence of ADSCs. The white arrows show the migration areas in the embryo. (b) The table shows the number of cells inoculated in zebrafish embryos and the proportion of tumors formed in each condition. SiHa, SiHa + ADSC, or control cells: ADSC, HaCaT + ADSC, SiHa + HaCaT and SiHa + NIH3T3 were inoculated into zebrafish embryos, and the tumors were monitored every day for 5 days. (c) The graph depicts the frequency of CSC in each condition representing the number of cells injected with respect to the logarithmic fraction of animals without tumors. (d) The table shows the frequency of CSC calculated based on the ELDA software. (e) The images show tumors developed during 5 days in zebrafish embryos inoculated with ADSC, SiHa or SiHa + ADSC cells. Each experiment was repeated at least three times. (f) The table shows the number of cells inoculated in zebrafish embryos and the proportion of tumors formed in embryos injected with CaSki cells or CaSki + ADSCs cells. (g) The table shows the frequency of CSC calculated based on the ELDA software. (h) The graph depicts the frequency of CSC in each condition representing the number of Caski cells injected with respect to the logarithmic fraction of animals without tumors. (i) The images show tumors developed during 5 days in zebrafish embryos inoculated with CaSki or CaSki + ADSC cells.

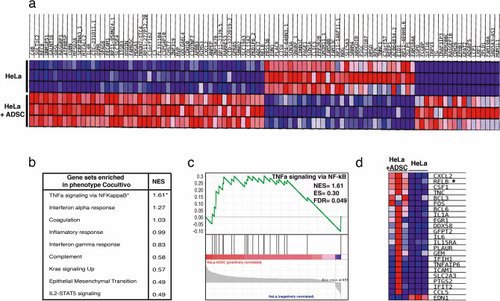
The NF-Kappa B pathway is the most activated pathway during the coculture of HeLa-ADSC. (a) Heat map shows the main differentially expressed genes in the HeLa cell line cultured in the presence or absence of ADSC. The expression values are represented as colors, where the range of colors (red, pink, light blue, dark blue) represents the range of expression values (high, moderate, low, lowest). (b) Table shows the main phenotypes enriched in HeLa cells due to the presence of ADSCs obtained from a gene set enrichment analysis (GSEA). For each of the phenotypes, the normalized enrichment score (NES) is indicated. (c) Analysis of GSEA showing significant enrichment (NES = 1.61 and an FDR = 0.049) of the TNFα-NF-kappa B signaling pathway in cervical cancer cells due to the presence of ADSCs. (d) The heat map shows the subset of enriched genes involved in the TNFα-NF-kappa B pathway, where most deregulated genes are involved in the noncanonical NF-Kappa B pathway, such as RELB.

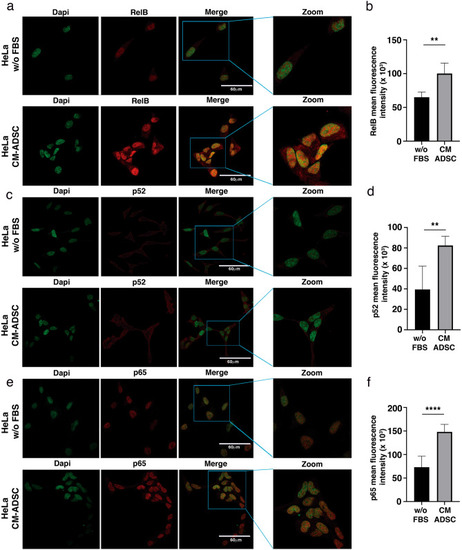
ADSCs induce the expression of the NF-kappa B molecules in CC cells. (af) The photographs show the expression of transcription factors of the NF-Kappa B family including RelB (a), p52 (c) and p65 (e) obtained by immunofluorescence of HeLa cells cultured with serum-free DMEM medium or ADSC-CM (free of serum) for 24 h. The images were taken under a confocal microscope. The scale bar = 60 μm. The cell nuclei were contrasted with DAPI. Each experiment was repeated at least three times and to quantify the expression levels of Relb (b), p52 (d), and p65 (f), the intensity of fluorescence was quantified using ImageJ. Graph represents three biological replicates, error bars are s.d. and ****p < 0.0001 and **p < 0.01.

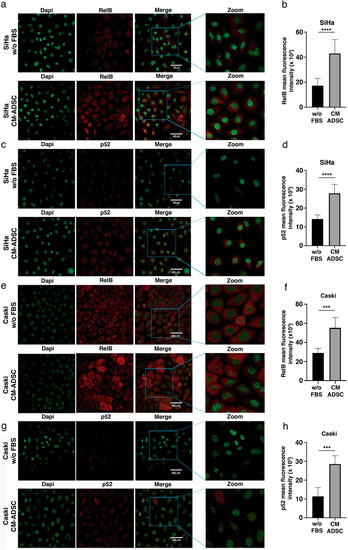
ADSC induces the activation of the NF-kappa B pathway in SiHa and CaSki cells. (ah) The photographs show the expression of RelB and p52 obtained by immunofluorescence of SiHa (ac) or CaSki (eg) cells cultured with serum-free DMEM or ADSC-CM (free of serum) for 24 h. The images were taken under a confocal microscope. The scale bar = 40 μm. The cell nuclei were contrasted with DAPI. Each experiment was repeated at least three times. To quantify the expression levels, the intensity of fluorescence was quantified using Image J. Graphs show the mean fluorescence intensity of RelB (b), p52 (d) in SiHa and Relb (f) and p52 (h) in Caski cells. Graph represents three biological replicates, error bars are s.d. and ****p < 0.0001 and *** p < 0.001.

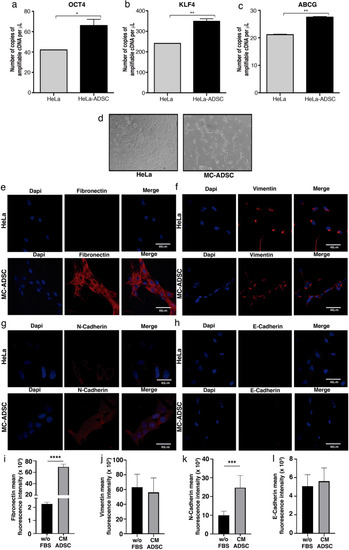
ADSC promotes a stem cell and EMT phenotype in HeLa cells. (a–c) Graphs show the expression level of pluripotency genes evaluated by ddPCR in HeLa control vs HeLa cells cocultured with ADSC. Pluripotency genes include OCT4 (a), KLF4 (b) and ABCG (c). The error bars represent the means ± standard deviation (SD). (d) Schematic representation shows that cervical cancer cells exhibit an EMT-like phenotype induced by the conditioned medium of ADSC. Expression of EMT markers including fibronectin (e), Vimentin (f), N-cadherin (g) and E-cadherin (h) analyzed by immunofluorescence of HeLa cells cultured with or without conditioned ADSC. EMT proteins were stained with Cy3-conjugated secondary antibody and nuclei were stained with 4′-6-Diamidino-2-phenolindole (DAPI). Images were taken in a confocal microscope using an × 40 oil lens. Photographs are representative of three independent experiments. (i–j) To quantify the expression levels of fibronectin (i), vimentin (j), N-cadherin (k) and E-cadherin (l), the intensity of fluorescence was quantified using Image J. Graph represents three biological replicates, error bars are s.d and ****p < 0.0001 and ***p < 0.001.

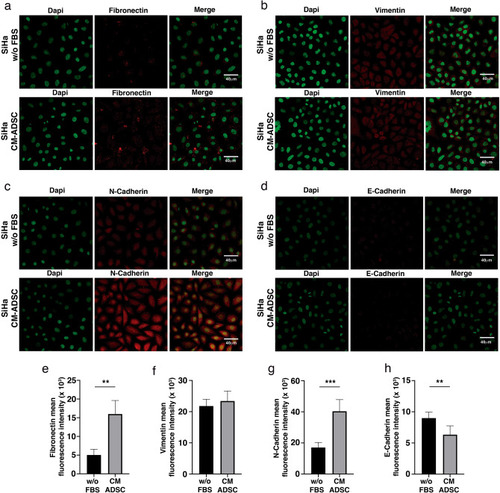
ADSC induce an EMT phenotype in SiHa cells. (ad) Immunofluorescence analysis of EMT markers including fibronectin (a), Vimentin (b), N-cadherin (c) and E-cadherin (d) in SiHa cells cultured with or without conditioned medium of ADSC. EMT proteins were stained with Cy3-conjugated secondary antibody and nuclei were stained with 4′-6-Diamidino-2-phenolindole (DAPI). Images were taken in a confocal microscope using an × 40 oil lens. Photographs are representative of three independent experiments. To quantify the expression levels of fibronectin (e), vimentin (f), N-cadherin (g) and E-cadherin (h), the intensity of fluorescence was quantified using Image J. Graph represents three biological replicates, error bars are s.d. and **p < 0.01 and ***p < 0.001.

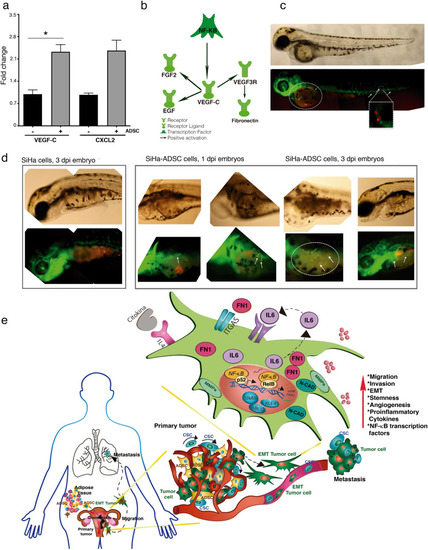
ADSC modulate angiogenesis in CC tumors. (a) Graph shows the fold increase of DE mRNAs involved in angiogenesis obtained from HeLa/ADSC RNAseq data. Angiogenesis-related mRNAs shown are VEGF-C, and CXCL2. (b) Representative network of KPA analysis showing that NF-Kappa B/VEGF-C activates the signaling of angiogenic factors in HeLa cells cocultured in the presence of ADSC. (c) Representative photograph of the infiltration of SiHa cells in the blood vessels of fli1a embryos: EGFP after 12 h post-injection is shown. The SiHa cells are observed in red color and blood vessels in green. (d) Representative figure showing the formation of new blood vessels in the yolk of embryos from day 1 dpi and 3 dpi of SiHa cells vs SiHa-ADSC. (e) The illustration built with the experimental data obtained, indicates that the ADSCs migrate from the adipose tissue to CC tumor and there, they increase the malignant phenotype of the CC cells and promoting metastasis. The ADSC potentiate the malignant phenotype of cervical cancer cells by increasing the non-canonical NF-Kappa B pathway, causing an increase in the expression of chemokines, transcription factors, metalloproteases, integrins, etc., which contribute to the increased migration and invasion capacity of cancer cells. In addition, ADSC activate the EMT process mainly due to the increase of Fibronectin in CC cells. Finally, ADSCs induce the angiogenic potential that plays an important role in tumor progression. It should be mentioned that all these phenotypic changes could be given by the activation of the NF-Kappa B pathway.

Acknowledgments
This image is the copyrighted work of the attributed author or publisher, and ZFIN has permission only to display this image to its users. Additional permissions should be obtained from the applicable author or publisher of the image. Full text @ Sci. Rep.