IMAGE

Figure 1

ID
ZDB-IMAGE-210307-4
Source
Figures for Castro-Oropeza et al., 2020
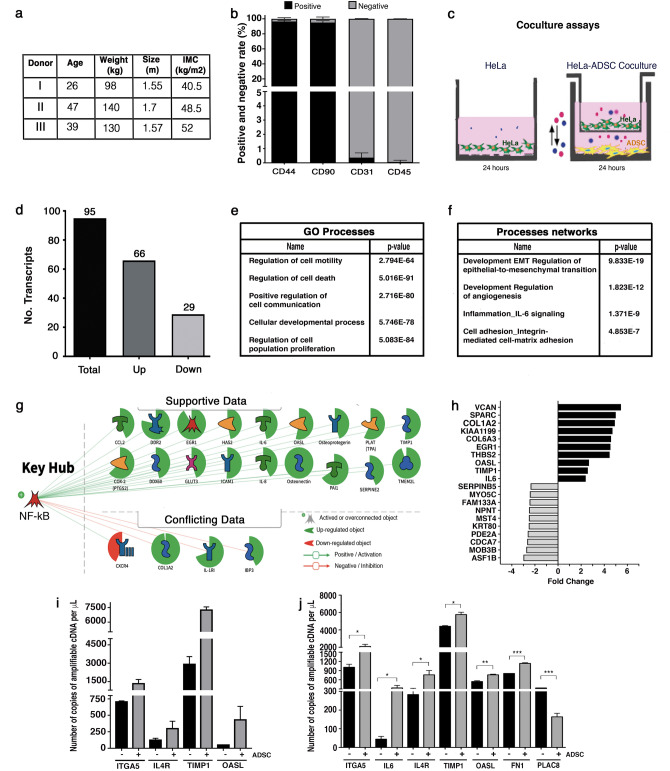
Image
Figure Caption

Figure 1

The coculture of HeLa/ADSC induces changes in the transcriptome of HeLa cells. (a) ADSCs were obtained from three donor patients. The table summarizes the main characteristics of the donor patients who underwent gastric bypass. (b) The purity of ADSCs in each patient was evaluated by flow cytometry analysis of cell surface markers including CD44, CD90, CD31 and CD45. The graph shows the percentage of positive and negative cells to each marker (n = 3 patients, 2 replicates, error bars = s.d.). (c) HeLa cells were cultured alone or in the presence of ADSCs by an indirect coculture system. The picture show that both cells lines are cultured in the same medium, but they are physically separated by a permeable membrane avoiding direct contact. (d) Bar chart shows the mRNAs altered in HeLa cells due to the presence of ADSCs. (e) The table shows the main molecular and cellular processes altered during coculture in HeLa. (f) The table shows the processes networks enriched during coculture in HeLa. (g) Schematic overview showing NF-kappa B as essential key hub driving gene expression, which was predicted to be activated in HeLa cells cocultured with ADSCs. (h) Top 20 differentially expressed genes in HeLa during coculture with ADSCs. (ij). Quantification of gene expression by ddPCR showing the validation of mRNAs altered in HeLa by the presence of ADSCs obtained from patients (j) or ATCC (k). Graphs represent three biological replicates, and the error bars are s.d., *p < 0.05).

Acknowledgments
This image is the copyrighted work of the attributed author or publisher, and ZFIN has permission only to display this image to its users. Additional permissions should be obtained from the applicable author or publisher of the image. Full text @ Sci. Rep.