
- Title
-
Evaluation of the Anticancer Activities of Novel Transition Metal Complexes with Berenil and Nitroimidazole
- Authors
- Czarnomysy, R., Radomska, D., Muszy?ska, A., Hermanowicz, J.M., Prokop, I., Bielawska, A., Bielawski, K.
- Source
- Full text @ Molecules
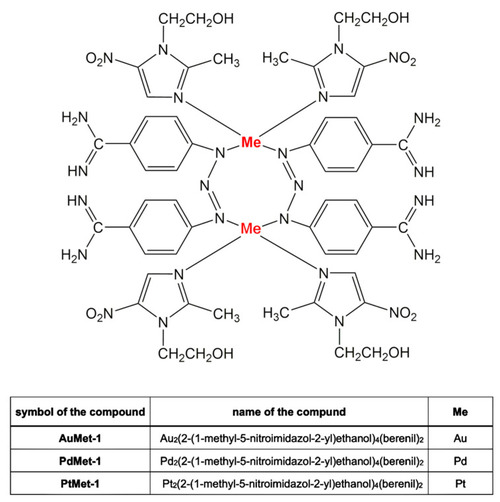
Structures of novel transition metal complexes (Au, Pd, Pt) with berenil and 2-(1-methyl-5-nitroimidazol-2-yl)ethanol. |
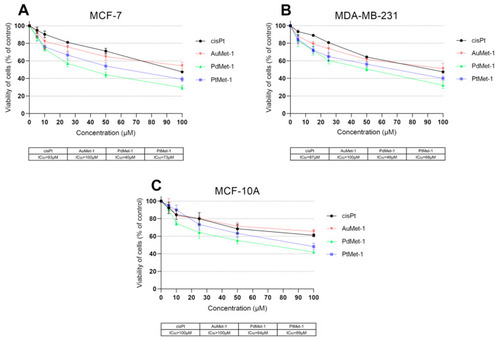
Viability of MCF-7 (A) and MDA-MB-231 (B) breast cancer cells and normal human breast epithelial cell MCF-10A (C) treated for 24 h with different concentrations of the tested compounds: AuMet-1, PdMet-1, PtMet-1 and cisplatin. Mean values �SD from 3 independent experiments (n = 3) done in duplicate are presented. |
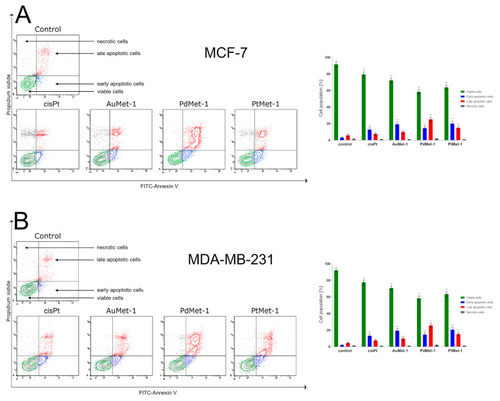
Flow cytometry analysis of MCF-7 (A) and MDA-MB-231 (B) breast cancer cells after 24-h incubation with AuMet-1, PdMet-1, PtMet-1 and cisplatin (50 ?M) and subsequent staining with Annexin V and propidium iodide. Mean percentage values from 3 independent experiments (n = 3) done in duplicate are presented. *p < 0.05 vs. control group, ** p < 0.01 vs. control group. |
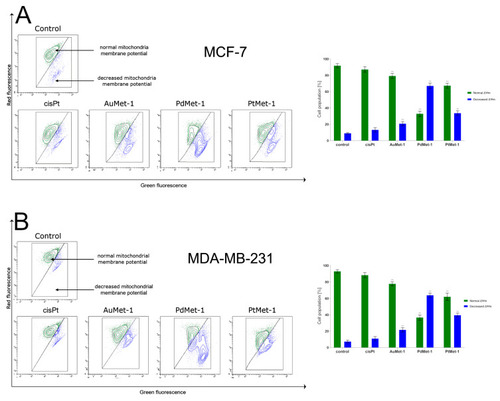
Fluorescence of MCF-7 (A) and MDA-MB-231 (B) breast cancer cells treated for 24 h with AuMet-1, PdMet-1, PtMet-1 and cisplatin (50 ?M) incubated with mitochondrial membrane potential probe JC-1. Mean percentage values from three independent experiments (n = 3) done in duplicate are presented. * p < 0.05 vs. control group, ** p < 0.01 vs. control group. |
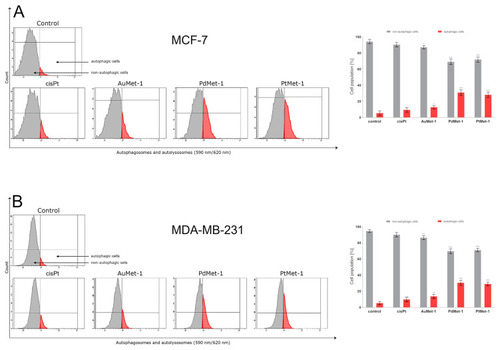
Autophagy induction in MCF-7 (A) and MDA-MB-231 (B) breast cancer cells measured by flow cytometry using Autophagy Probe (right-red histogram) compared to negative control cells (left- gray histogram) after 24-h incubation with AuMet-1, PdMet-1, PtMet-1 and cisplatin (50 �M). Mean percentage values from 3 independent experiments (n = 3) done in duplicate are presented. * p < 0.05 vs. control group, ** p < 0.01 vs. control group, *** p < 0.001 vs. control group. |
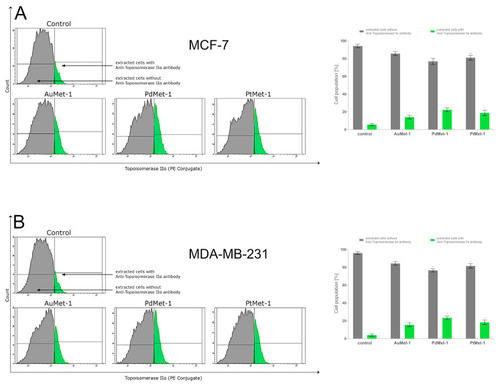
Anti-topoisomerase IIα Antibody flow cytometric analysis of MCF-7 ( |
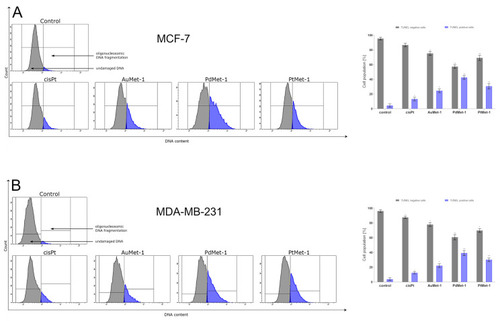
Flow cytometric analysis of DNA fragmentation of MCF-7 (A) and MDA-MB-231 (B) breast cancer cells after 24?h of incubation with AuMet-1, PdMet-1, PtMet-1 and cisplatin (50??M) using TUNEL assay. Histograms present TUNEL negative and TUNEL positive cells. Mean percentage values from 3 independent experiments (n = 3) done in duplicate are presented. * p < 0.05 vs. control group, ** p < 0.01 vs. control group. |
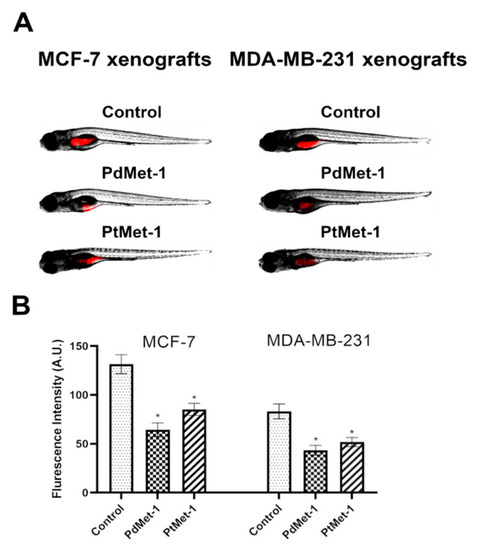
Site-specific injection (yolk sac) of transfected (red) breast cancer cells (MCF-7 and MDA-MB-231) into 48 hpf zebrafish embryos and imaging analysis of tumor growth after 48 h of incubation with PdMet-1 and PtMet-1 (100 �M) (A). Quantification of total mCherry fluorescence by breast cancer cells 3 days after injection (B) n = 4, * p < 0.05. |