
Image
|
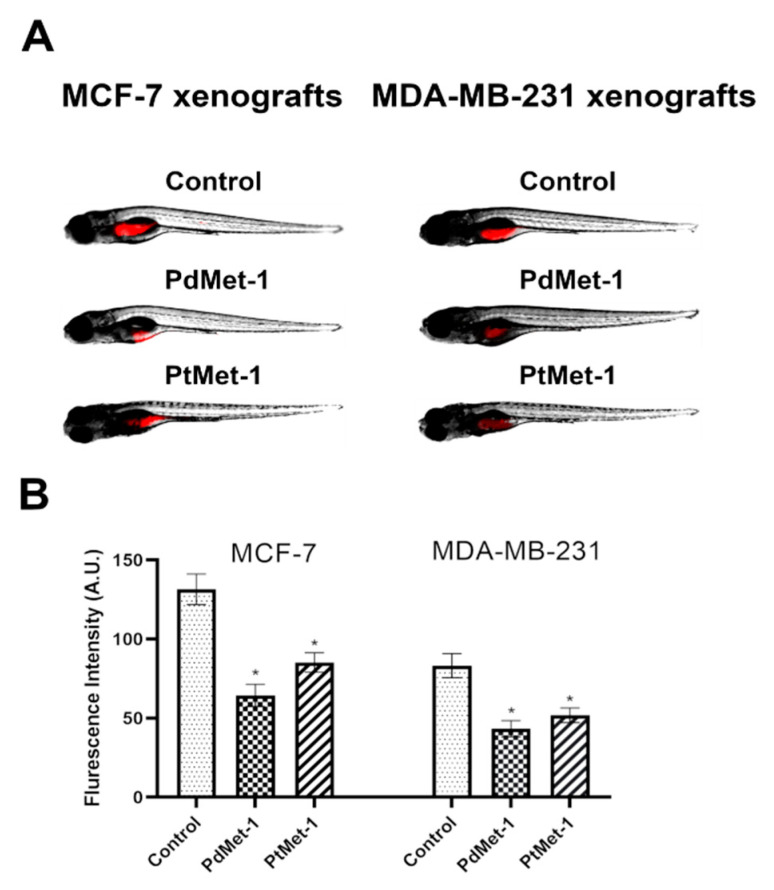
Figure Caption
Figure 8 Site-specific injection (yolk sac) of transfected (red) breast cancer cells (MCF-7 and MDA-MB-231) into 48 hpf zebrafish embryos and imaging analysis of tumor growth after 48 h of incubation with PdMet-1 and PtMet-1 (100 µM) (A). Quantification of total mCherry fluorescence by breast cancer cells 3 days after injection (B) n = 4, * p < 0.05.
Acknowledgments
This image is the copyrighted work of the attributed author or publisher, and
ZFIN has permission only to display this image to its users.
Additional permissions should be obtained from the applicable author or publisher of the image.
Full text @ Molecules