
Image
|
Figure Caption
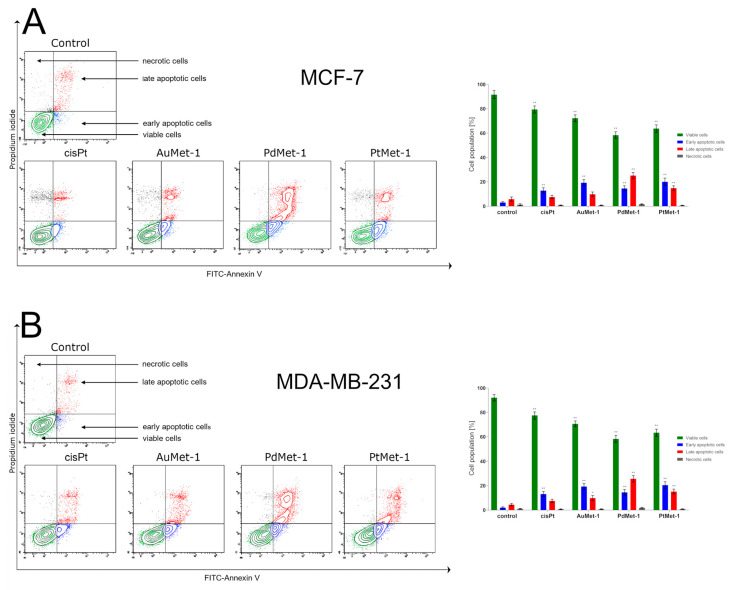
Figure 3 Flow cytometry analysis of MCF-7 (A) and MDA-MB-231 (B) breast cancer cells after 24-h incubation with AuMet-1, PdMet-1, PtMet-1 and cisplatin (50 μM) and subsequent staining with Annexin V and propidium iodide. Mean percentage values from 3 independent experiments (n = 3) done in duplicate are presented. *p < 0.05 vs. control group, ** p < 0.01 vs. control group.
Acknowledgments
This image is the copyrighted work of the attributed author or publisher, and
ZFIN has permission only to display this image to its users.
Additional permissions should be obtained from the applicable author or publisher of the image.
Full text @ Molecules