
Image
|
Figure Caption
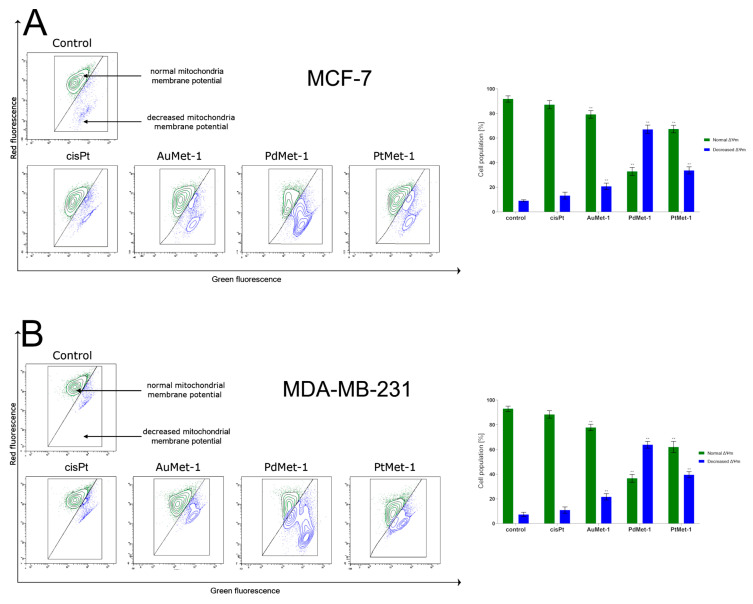
Figure 4 Fluorescence of MCF-7 (A) and MDA-MB-231 (B) breast cancer cells treated for 24 h with AuMet-1, PdMet-1, PtMet-1 and cisplatin (50 μM) incubated with mitochondrial membrane potential probe JC-1. Mean percentage values from three independent experiments (n = 3) done in duplicate are presented. * p < 0.05 vs. control group, ** p < 0.01 vs. control group.
Acknowledgments
This image is the copyrighted work of the attributed author or publisher, and
ZFIN has permission only to display this image to its users.
Additional permissions should be obtained from the applicable author or publisher of the image.
Full text @ Molecules