
FIGURE
Figure 5
- ID
- ZDB-FIG-210307-72
- Publication
- Czarnomysy et al., 2020 - Evaluation of the Anticancer Activities of Novel Transition Metal Complexes with Berenil and Nitroimidazole
- Other Figures
- All Figure Page
- Back to All Figure Page
Figure 5
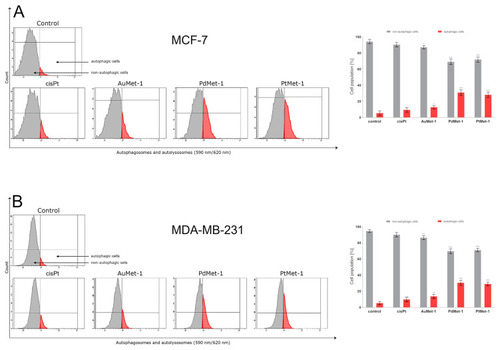
Autophagy induction in MCF-7 (A) and MDA-MB-231 (B) breast cancer cells measured by flow cytometry using Autophagy Probe (right-red histogram) compared to negative control cells (left- gray histogram) after 24-h incubation with AuMet-1, PdMet-1, PtMet-1 and cisplatin (50 µM). Mean percentage values from 3 independent experiments (n = 3) done in duplicate are presented. * p < 0.05 vs. control group, ** p < 0.01 vs. control group, *** p < 0.001 vs. control group. |
Expression Data
Expression Detail
Antibody Labeling
Phenotype Data
Phenotype Detail
Acknowledgments
This image is the copyrighted work of the attributed author or publisher, and
ZFIN has permission only to display this image to its users.
Additional permissions should be obtained from the applicable author or publisher of the image.
Full text @ Molecules