
- Title
-
Development of curcumin-loaded zein nanoparticles for transport across the blood-brain barrier and inhibition of glioblastoma cell growth
- Authors
- Zhang, H., van Os, W.L., Tian, X., Zu, G., Ribovski, L., Bron, R., Bussmann, J., Kros, A., Liu, Y., Zuhorn, I.S.
- Source
- Full text @ Biomater Sci
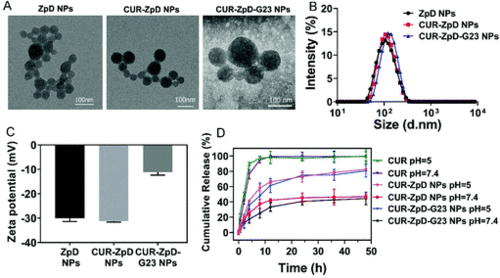
Characterization of ZpD, CUR-ZpD and CUR-ZpD = G23 NPs. TEM images (A), size distribution (B) and zeta potential (C) of ZpD, CUR-ZpD and CUR-ZpD-G23 NPs. (D) In vitro release of CUR from CUR-ZpD and CUR-ZpD-G23 NPs over time at different pH values (pH 5.0 and 7.4). |
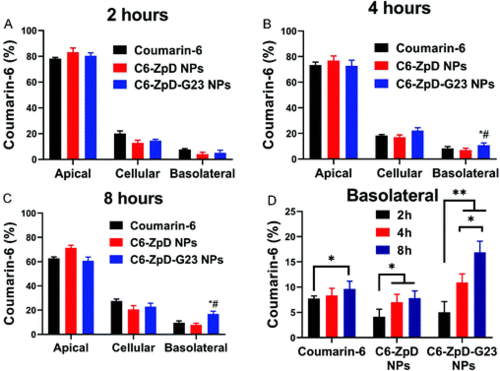
Transcytosis of ZpD and ZpD-G23 NPs across an in vitro BBB model. Distribution of coumarin-6 and coumarin-6 labeled ZpD and ZpD-G23 NPs in the filter-free BBB model after incubation (at an equal concentration of 1 μg mL−1 coumarin-6) for 2 (A), 4 (B) and 8 (C) hours at 37 °C (n = 3 in duplicate). Basolateral fluorescence signal represents fraction that crossed the BBB. (D) Basolateral fluorescence signal after incubation of the BBB model with coumarin-6 and coumarin-6 labeled ZpD and ZpD-G23 NPs for 2, 4, and 8 hours. *Significantly different from free coumarin-6; # significantly different from Coumarin6-ZpD NPs, P < 0.05. |
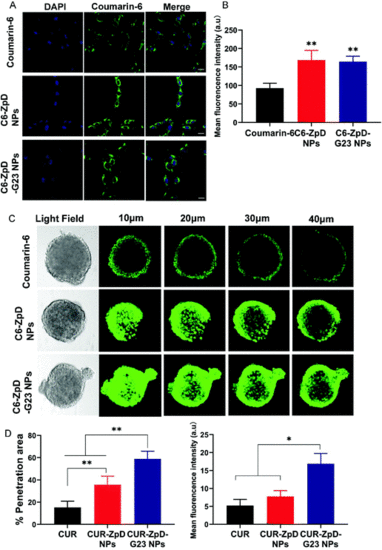
Cellular uptake and tumor spheroid penetration of ZpD and ZpD-G23 NPs. (A) CLSM images of C6 glioma cells after incubation with coumarin-6, C6-ZpD NPs and C6-ZpD-G23 NPs for 4 h. Green colors represent coumarin-6 fluorescence. Cell nuclei were stained with DAPI (blue). Scale bars represent 20 μm. (B) The mean fluorescence intensity of cells with different treatment (**Significantly different from coumarin-6, p < 0.005). (C) CLSM images for 3D-cultured C6 glioma tumor spheroids after treatment with coumarin-6, C6-ZpD NPs and C6-ZpD-G23 NPs for 4 h (scale bar represents 100 μm). Confocal sections at 10, 20, 30 and 40 μm from the rim of a spheroid are shown. (D) Semi-quantitative analysis (% penetration area and mean fluorescence intensity) of CLSM images taken at 40 μm from the top of spheroids using ImageJ software. Data represented as mean ± S.D. of three independent experiments and 12 spheroids per condition (*p < 0.05, **p < 0.005). |
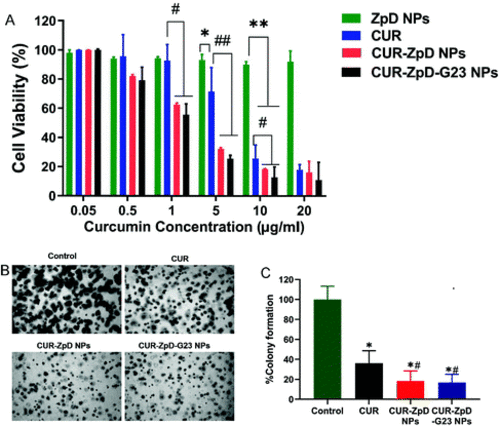
Cell viability and colony formation of C6 glioma cells in presence of CUR-ZpD and CUR-ZpD-G23 NPs. (A) Relative viability of C6 glioma cells after incubation with different concentrations of empty ZpD NPs, free curcumin and CUR-loaded ZpD NPs with and without G23 for 24 h. The weight concentration of empty ZpD NPs equals to that of CUR-ZpD-G23 NPs (n = 3). (B) Phase contrast images of C6 glioma cell colonies following soft agar colony formation assay in presence of CUR, CUR-ZpD and CUR-ZpD-G23 NPs for 9 days. (C) Quantification of colony formation assay results, showing suppressive effects of CUR, CUR-ZpD NPs and CUR-ZpD-G23 NPs on colony formation of C6 glioma cells. Control (untreated cells) set at 100%. *Significantly different from control; # significantly different from CUR at equivalent CUR concentrations (n = 3 in triplicate, *p < 0.05, **p < 0.005, #p < 0.05, ##p < 0.005). |
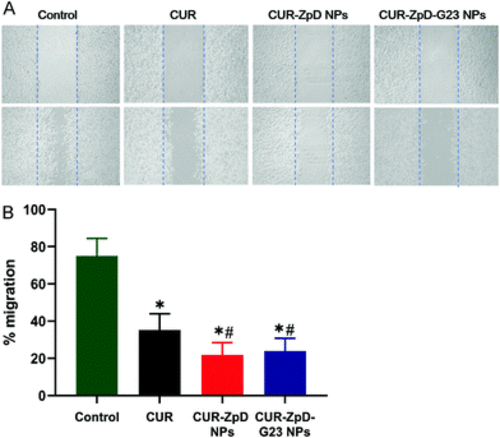
Cell migration of C6 glioma cells upon treatment with CUR, ZpD, CUR-ZpD and CUR-ZpD-G23 NPs. (A) Phase contrast images of migration of C6 glioma cells pretreated with CUR, CUR-ZpD and CUR-ZpD-G23 NPs following scratch assay at t = 0 h (top row) and t = 24 h (bottom row). (B) Quantification of scratch assay results, showing suppressive effects of CUR, CUR-ZpD NPs and CUR-ZpD-G23 NPs on migration of C6 glioma cells. Control (untreated cells) set at 100%. *Significantly different from control; # significantly different from CUR at equivalent CUR concentrations (n = 3 in triplicate, p < 0.05). |
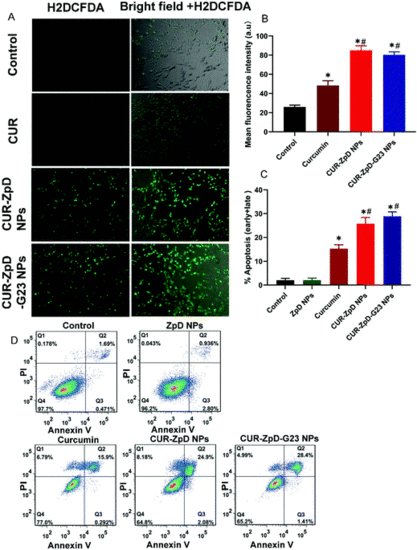
ROS activity and apoptosis in C6 glioma cells after incubation with CUR, CUR-ZpD NPs and CUR-ZpD-G23 NPs (Curcumin = 5 μg ml−1) for 4 h. (A) Fluorescence microscopy images of oxidized H2DCFDA (DCF), i.e., a measure of ROS activity, in C6 glioma cells following treatment with CUR, CUR-ZpD and CUR-ZpD-G23 NPs. (B) Quantification of mean DCF fluorescence intensity of cells following treatment with CUR, CUR-ZpD and CUR-ZpD-G23 NPs. (C) Apoptosis values in C6 glioma cells as induced by incubation with CUR, CUR-ZpD NPs and CUR-ZpD-G23 NPs for 24 h, obtained by Annexin V-FITC/PI detection by flow cytometry. (D) Representative Annexin-V/PI flow cytometry dot plots. Top right quadrant shows Annexin-V/PI double positive cells. (*Significantly different from control; # significantly different from CUR at equivalent CUR concentrations, n = 3 in triplicate, p < 0.05). |
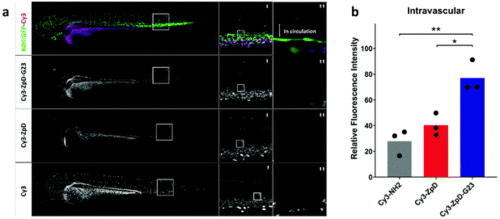
Biodistribution of Cy3-labeled ZpD and ZpD-G23 NP formulations in transgenic kdrl:GFP (green) zebrafish larvae. (a) Confocal microscopy stacks of kdrl:GFP (green) injected with Cy3-ZpD-G23, Cy3-ZpD or Cy3-NH2 (magenta), column left and middle represent maximum projections and right column represents sum of squares of four confocal slices. (b) Bar plot of confocal slices quantified by fluorescence intensities of ROI located in the Dorsal Aorta. Statistical analysis using One-way ANOVA and additional unpaired t-test was performed. *p = <0.05, **p = <0.01. |