
- Title
-
Utilization of the zebrafish model to unravel the harmful effects of biomass burning during Amazonian wildfires
- Authors
- Babi?, S., ?i?mek, L., Mar?avelski, A., Malev, O., Pflieger, M., Strunjak-Perovi?, I., Popovi?, N.T., ?o?-Rakovac, R., Treb?e, P.
- Source
- Full text @ Sci. Rep.

Concentration?response curves used for the calculations of the D. rerio: (a) mortality, (b) abnormality, and (c) unhatching rate after 96 h of exposure to CAT, GUA, 4NC, 5NG, and 4,6DNG. Error bars indicate standard deviations (SD). Dotted lines represent 95% confidence intervals. Dose?response curves were generated using GraphPad Prism software version 6.0 PHENOTYPE:
|

Graphical view of ECOSAR predicted and experimentally obtained toxicity values within the toxicity gradient according to the criteria set by the European Union |

Recorded sublethal morphological effects in PHENOTYPE:
|
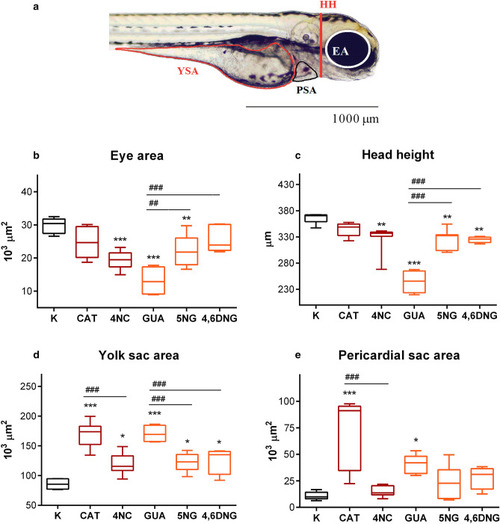
Morphometric measurements of PHENOTYPE:
|
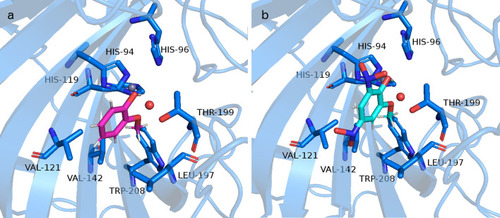
Representation of the interactions between ( |