
Image
|
Figure Caption
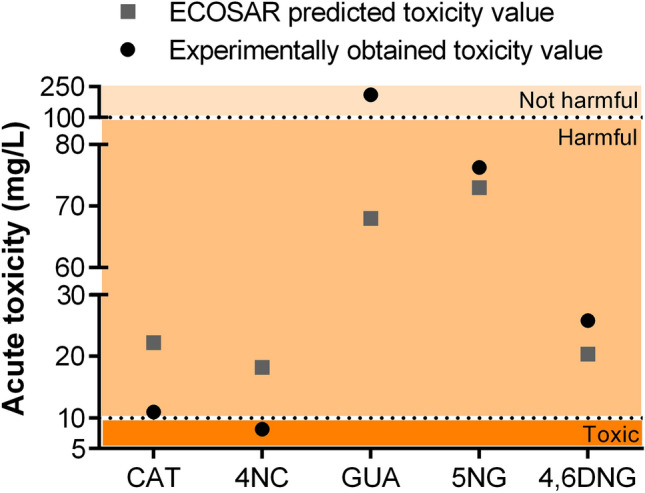
Figure 2
Graphical view of ECOSAR predicted and experimentally obtained toxicity values within the toxicity gradient according to the criteria set by the European Union
Acknowledgments
This image is the copyrighted work of the attributed author or publisher, and
ZFIN has permission only to display this image to its users.
Additional permissions should be obtained from the applicable author or publisher of the image.
Full text @ Sci. Rep.