
Image
|
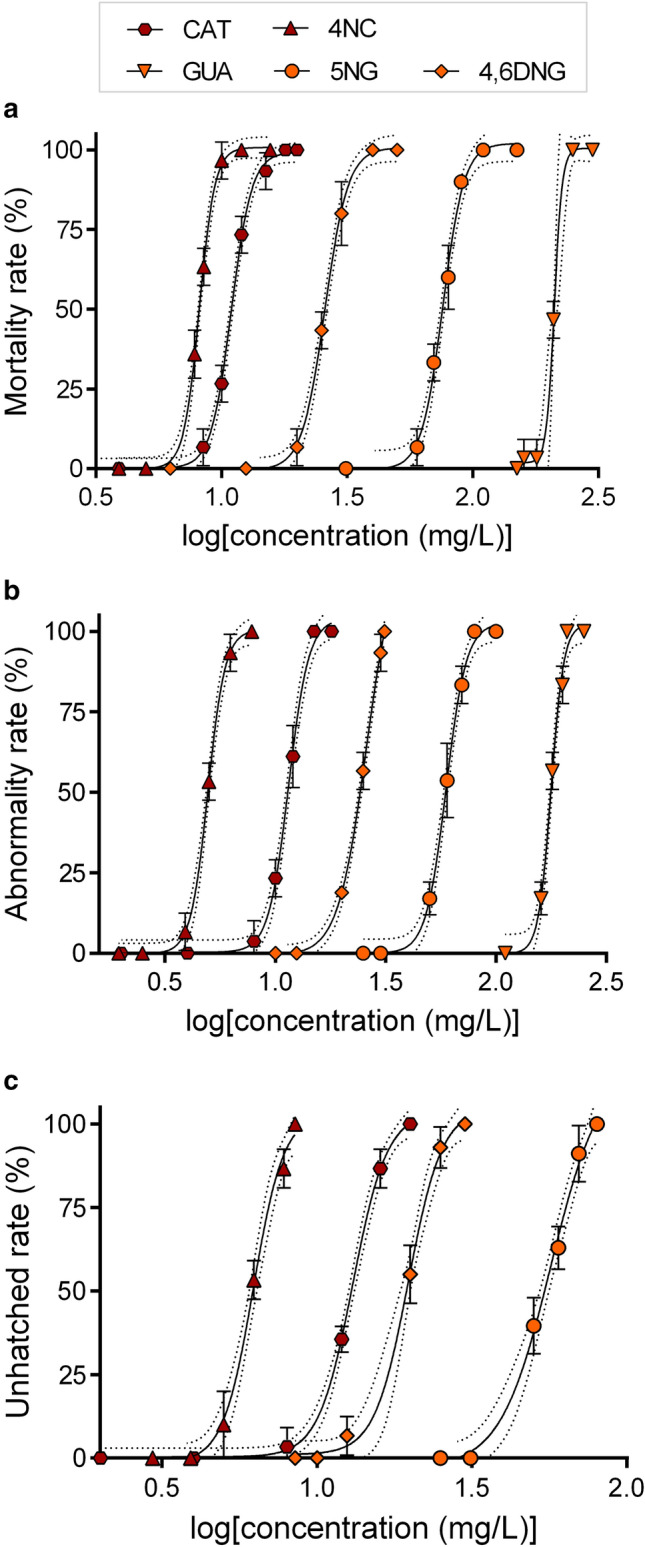
Figure Caption
Figure 1 Concentration–response curves used for the calculations of the D. rerio: (a) mortality, (b) abnormality, and (c) unhatching rate after 96 h of exposure to CAT, GUA, 4NC, 5NG, and 4,6DNG. Error bars indicate standard deviations (SD). Dotted lines represent 95% confidence intervals. Dose–response curves were generated using GraphPad Prism software version 6.0
Figure Data
Acknowledgments
This image is the copyrighted work of the attributed author or publisher, and
ZFIN has permission only to display this image to its users.
Additional permissions should be obtained from the applicable author or publisher of the image.
Full text @ Sci. Rep.